Math tidbits and sometimes a little more.
Fun facts to know and tell.
Math tidbits and sometimes a little more.
Fun facts to know and tell.
Wednesday, February 13, 2013
Six weeks of climate data: Northern Polar Region #6, 150° to 180° East
Now we reach the last region of the Eastern Hemisphere in the Arctic, deep into Siberia, sparsely populated.
Only 1,515 readings in 56 years, about a tenth of the readings analyzed in Region 1, the Arctic section of Scandinavia. As we go through all 72 regions, we will see numbers even sparser than these, regions with so little data that they will deny fair analysis. I am using this data set, but as we see the coverage pattern has only one big black dot, and even the next size of dark gray dots are very nearby.
Simply put, this data tells us nothing about the North Pole, but instead gives the climate patterns for the town of Pevek on the East Siberan Sea and some of the villages on the shores of the Kolyma River.
Winters in this region stayed relatively static during the last half of the 20th Century, but we see a big jump in both the record high and the most recent Oceanic Niña Interval (ONI) from 1999-2010. Six degrees Celsius is a Big Damn Deal, but it is just one season.
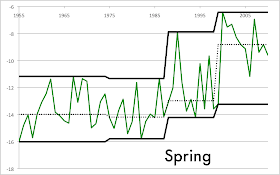
Spring is very similar, but this time the jump is closer to four degrees Celsius.
The Summer median is much calmer in its change from 20th to 21st Centuries. The big gap here is between the 1975-1988 and 1988-1999 ONI.
Fall looks like Winter and Spring. No serious sign of climate change from 1955 to 1999, then BANG! Slightly more than a six degree difference between the last 20th Century interval and the first in the 21st Century.
There were a total of 48 readings, 12 in each season. Intervals can finish 1st, 2nd, 3rd or 4th, and ties are possible.
Most warmest readings: 1999-2010 with 10, 1988-1999 1955-1975 with 1.
Most 2nd warmest readings: 1988-1999 with 9½, 1955-1975 with 2 and 1999-2010 with ½.
Most 3nd warmest readings: 1955-1975 with 6, 1975-1988 with 4, 1988-1999 with 1½ 1999-2010 with ½.
Most coldest readings: 1975-1988 with 8, 1955-1975 with 3 and 1999-2011 with 1
Is this region warming from interval to interval? The best arguments say no, there was a cooling trend in the second ONI.
Is the rate of warming increasing? Yes. Huge jumps dominate the shift from 20th Century to 21st Century.
Tomorrow, we start looking at the Western half of the Arctic Circle, a region covering parts of Russia and Alaska. I promise to send Sarah Palin an invitation.


No comments:
Post a Comment