Showing posts with label climate change. Show all posts

Friday, October 4, 2013

The Correlation Coefficient R and the reduction of range.

 Those who followed my series on climate change might remember that I would take some area I could define as a rectangle in longitude and latitude and track the average temperature by year, comparing equivalent seasons. (To be precise, if a longitude/latitude area include either the North or South Pole, it would be more like a slice of pie than a rectangle.) I then split the time span from 1955 to 2010 into four eras based on the El Niño/La Niña cycles, these in particular each starting and ending in a strong La Niña year.

This particular region and season, Siberia in Spring, has a clearly increasing trend of the median temperature, the dotted red line moving up in four separate steps. The lowest temperature registered only moves upward twice and the maximum average temperature takes a step down in the era of 1999-2010, as the highest temperature was registered back in the 1990s.


Another method would be to add a line of regression, also known as a trendline or predictor line or the line of least squares. Excel has an option which gives the equation of the line and the variance R². R is called the correlation coefficient and it varies between -1 and 1. R² must be between 0 and 1 and is sometimes thought of as a proportion. In this case, the .3655 would be the proportion we would assign to the general increase we see in the temperatures, while the fluctuations are about .6345 of the influence.

This doesn't sound very convincing, but if R² = .3655, R in this case would be +.6046, a value that by nearly every standard of correlation is considered high, though it doesn't meet the Rule of Thumb criteria for very high, which would be over .8.

This is one of the many reasons I don't love using the predictor line and the correlation coefficient. The statements of confidence seem arbitrary - I know of three different systems and they disagree radically on whether an R score is strong or not - but also there is a way to cherry pick data in both directions, either to show more correlation or less.
 

Generally though not always, taking a subset of a sample by restricting the range will result in R and R² being reduced. For example, if we look at the first Consistent Oceanic Niña Interval from 1955 to 1975, we see somewhat less overall increase (here we check the number multiplying x, which went from .0417 to .0346) and a drastic drop in R² from .3655 to .05097. Here I can say without fear of contradiction that the correlation is not impressive.


In our second interval, R² is stronger at .19237, but still well below the larger set's value of .3655. It could be considered moderately strong by some measures, but notice that here the trend shows the region cooling. (It really is coincidence that the first year of this era shows a large jump in temperature over the previous.)


Here again we see a downward sloping trendline and an extremely weak R² value of .01592, which is to say nearly no correlation.


Yet again, a small downward slope and a low R² value.

In my view, the problem is cherry picking in both directions. People who wish to downplay or deny warming temperatures can take smaller samples, but when they do, the R² value will often give little confidence in the trend they try to show. On the other hand, people wanting to show strong evidence of warming have a natural advantage of generally higher R² scores in larger data sets. To be fair, in this particular set it is impossible to create a subset longer than thirty years that doesn't show a warming trend, though it can be minimized and so can the correlation coefficient.

If anyone is coming to the blog for the first time, you should know that I am not a denier of the general warming trend in temperatures around the globe in my lifetime, which started in the Strong La Niña year of 1955. What I hope for is a discussion where both sides can agree on terms and methods and avoid cherry picking at all costs. I realize this hope may very well be in vain, and yet I hold on to it.

Tuesday, May 14, 2013

A prediction about the 2013 Atlantic Hurricane Season.


The climate scientists Michael E. Mann, Michael Kozar and Sonya Miller have come out with a prediction for the number of named storms in the 2013 Atlantic Hurricane season, which officially starts on June 1 and ends November 30. Their number is 16 with a 95% confidence interval of +/-4, which means 12 to 20 is the range they are 95% confident will contain the correct number and 16 is what they consider the most likely number. I will come back on December 1 to see how the prediction turned out.

To give an idea of the recent range here are the number of named storms in the years from 2000 to 2012.

2000:15
2001:15
2002:12
2003:16
2004:15
2005:28
2006:10
2007:15
2008:16
2009: 9
2010:19
2011:19
2012:19

Their calculations are based on more data than this, but it should be noted that 16 is the average of these 13 numbers.

Sunday, May 5, 2013

The statistical world: Part 5, assessing risks


Assessing risk is very difficult and it is a question that confronts us at all turns. In some cases, government has decided to penalize people who take some risks. You have to wear a seat belt while driving and you have to have proof of insurance. Both of these actions are penalized by fines. Driving under the influence can be a fine or can be jail time.

Smoking outside of designated areas can cost you money in this day and age as well, as can selling cigarettes or alcohol to minors. Governments around the country have taxed cigarettes much more heavily than other products.

The question is: just how dangerous is it to smoke? This is a difficult question to answer and the answer must be stated in statistical ways, which is to say we do not have proof like we have in mathematics, but instead confidence levels and correlations.

This means it is possible for a smoker to live to be 90 and die from some cause not related to smoking, just as it is possible for someone who quits smoking and exercises regularly to die at the age of 52 like Dr. Jim Fixx, a physician who advocated a life of regular strenuous exercise.


Here is a simple metaphor, and I admit it is likely too simple. Think of life as a game. The rules are just about the same for everyone, but we are all rolling our own set of dice. Certain risks are so big that you are opting for a set of dice that really do hate you, if I may borrow a joke from the great nerd cartoonist John Kovalic.

Still, there is wild variation. John Banner, the actor who played Sgt. Schultz on Hogan's Heroes, died just a few years after the series was over at the age of 63 from am abdominal hemorrhage. It would be easy and likely fair to blame him early death on his weight. But consider Leon Askin, another fat actor from Hogan's Heroes. He was big all his life and lived to be 97.

(Two other coincidences in the lives of Banner and Askin. Both were Austrian Jews. One part of that is not such a coincidence, since the regular actors playing German soldiers and/or Nazis on Hogan's Heroes were Jewish.)

This randomness is often used by people who want to downplay the risks of smoking, many of them in the pay of the tobacco industry, others addicts of the product. Among the addicts who likely took no cash from the tobacco industry to complain about the unfair restrictions on their habit are the great statistician Sir Ronald Fisher, the novelist and strong believer in evil government ineptness Ayn Rand and the musician and composer Joe Jackson, not to be confused with the father of The Jackson Five and daughters Janet and LaToya.
   

Which brings us to climate change. Again, this is a matter of statistical risk, not certain mathematical risk. Many of the arguments against any human cause for a warming climate have a stance similar to the arguments against links between smoking and human health risks. More than analogies, many people who were in the pay of the tobacco lobby are now in the pay of the petroleum industry.

To steal a joke from a friend who is a public defender, these people sell reasonable doubt at a reasonable price.

Regular readers will know I took a few months on this blog to look at climate data and came to the conclusion that the climate is changing and in the great majority of places, the climate is warming, in some places at catastrophic rates. As for human causes, to accept this we have to pile statistics upon statistics.  That said, the model for the increase in CO2 is a much better predictor than most statistical models and is showing no signs of slowing down as humans continue to consider their addiction to fossil fuels a God given right.

Again to quote Mr. Kovalic, when it comes to the climate, our dice really do hate us. It's time for all of us to try to do what we can to change the set of dice that will determine the future for the generations that will still be here when we are gone.

Thursday, March 28, 2013

A failed experiment - step by step

.

After I finished with the four weeks of climate data, I hoped to make some headway on removing the noise from the temperature data to make the trends easier to see.

This data is the average Winter temperature in Greenland from 1969 to 2010.


The dotted line shows the average of the averages.  The first half of the data would be 1969-1989, the second half 1990-2010.  It's easy to see the second half has more above average data than the first half.


A different way to measure things is the trendline, also known as the line of correlation or the best fitting line. There are two equations in the picture as well. Let me explain the constants.

0.0507 is the slope of the line. This means that if the rate continued into the future - and we can not assume it will - the temperature is increasing at about one degree every twenty years. That's pretty fast.

The -99.019 would be the temperature if the trendline line were taken back to 1 B.C. As I teach my statistics students, YOU ARE NOT SUPPOSED TO DO THAT!  The notice that the trendline is a line segment that doesn't continue either into the future or the past of the time period we decided to look at. Any methods for modeling future behavior have to be a lot more sophisticated than a trendline.

The 0.07203 is the correlation coefficient R². R² is always a number between 0 and 1, and the closer it is to 1, the more confident we are that the line tells us important information about the data. 0.07203 is not close to 1. Even with a data set with 42 points, the lowest R² that makes us 95% confident about what we can say is 0.0973.


Okay, the data isn't really close to linear. We can see that ourselves.  The reason I chose the years 1969 and 2010 is that those were peak years of the Atlantic Oscillation, the change in ocean temperatures that should have the most impact on Greenland temperature data.

As you can see, the Atlantic Oscillation is puny compared to the changes in average Winter temperatures in Greenland.  Be that as it may, let's factor them out to see what difference that makes.


The green line is the blue line - average - red line.  I subtracted the average just so the two lines wouldn't be right on top of each other. As you can see, factoring the oscillation out was not much change.


And now the trendline. Again, the constant -80.798 in the trendline equation is not important, but the slope of 0.0407 and the R² or 0.04628 are important. The slope says that upward movement is slower, only increasing a degree in 25 years instead of 20. (Note: Scientists agree than a degree in 50 years is fast, possibly catastrophic.  Either of these speeds is a cause for concern.)

The more important number is R² which shrunk from about 0.072 to 0.046.  If correlation had gone up enough to create 95% confidence, I would have considered that I was on the right track. But this experiment didn't work very well and it was not the only one.  Other seasons also showed more variation instead of less when the Oscillation was factored out Working with the stronger El Niño/La Niña oscillations on the data of a place like tropical India did not bring the correlation up.

I will continue to look at climate data and will occasionally present data on areas based on similarities of weather rather than just arbitrary longitude and latitude lines. I'm going to see if I can find a climate scientist who has time to talk about this stuff. But subtracting out the oscillations of ocean currents was a promising lead that turned out to be a dead end.

Stuff like that happens when you do research.


Sunday, March 24, 2013

The Atlantic Oscillation Data

Okay, I'll admit it. You are watching someone teaching themselves as much about climate data as they can on their own day by day. Yesterday, I wanted to see about the effect of La Niña and El Niño in the Indian/Pacific Oceans and the effect in the Atlantic.

Silly me. The Atlantic has its own oscillation.

The graph here is the Atlantic oscillation from 1948 to 2012. It is slower and smaller than the La Niña/El Niño changes, only making about a half degree plus or minus in any season at most, compared to about two degree change for La Niña and El Niño at their most severe. The smaller changes take decades to swing back and forth, while La Niña and El Niño can switch from high to low to high again in about ten years.

In any case, this new information means I have to do a little programming to deal with the new data. As the Gosh Darned Pater Familias is fond of saying, you learn something new every day if you are not careful.

Sunday, March 17, 2013

Four weeks of climate data:
Southern Temperate Region #4

Now we look at the temperate part of the South Pacific Ocean between New Zealand and South America.

Most of the famous South Pacific Islands are in the tropics. The best known of these islands are Easter Island, rightmost at (-105° long, -30° lat) and Pitcairn, where the Bounty mutineers settled, the second rightmost.


The low temperatures for Summer bounce around a lot, but the median shows steady increase.


Fall numbers show an increase at nearly every step.


Again, the low temperatures are bouncing around but the median grows steadily.

The cold Spring late last decade keeps this graph from showing steady increase everywhere.

Confidence of the region warming: 99.%
Confidence of decreasing rate: 65.8%
Change in median temperature from the 1955-1975 interval to the 1999-2010 interval: 0.45° C

We get a similar story to many of our regions. Yes, it's warming. No, we can't say if the rate is increasing or decreasing with any confidence and the amount of warming is in the range of a half degree Celsius in 56 years.


Tomorrow, our last two regions, Temperate South America and the temperate south Atlantic.

Saturday, March 16, 2013

Four weeks of climate data:
Southern Temperate Region #2

 The second region of the Southern Temperate Zone is the Indian Ocean with a few scattered islands.


There were only readings from a few islands, and the only weather station that kept consistent readings from 1955 to 2010 was on the French controlled island Kerguelen.


As I said earlier, this "temperate zone" is cold. This is down in The Fifties and Summer average temperatures wander between 3° C to 7° C. For Americans, that's between 37.4° F and 44.6° F.

Cold. The coldest metric shows an increase, but the median and high show that the 90s were a little warmer than the first decade of this century.


The Fall numbers look similar to Summer, only more so, the 90s warmer that The Oughts.


Winter's pattern is different. Generally we see an increase across all metrics, but very little overall.


Spring is like Winter, but all the metrics show the big jump between the 1955-1975 era and the 1975-1988 period.

Confidence of the region warming: 99%
Confidence of decreasing rate: 97.9%
Change in median temperature from the 1955-1975 interval to the 1999-2010 interval: 0.55° C

One island in an expanse of ocean, but it counts as a region.  It's warming but the rate is slowing down and the level of warming over 56 years is not particularly alarming.

Tomorrow, Australia and New Zealand lumped together in the third region then the gap between New Zealand and South America as Region #4.

Tuesday, March 12, 2013

Four weeks of climate data:
Northern Tropics Region #5

The fifth slice of the Northern Tropics covers all of Central America, much of Mexico and the Caribbean the the northwest corner of South America. This is one time when it might have made sense to make the slices different widths to get the rest of tropical South America north of the Equator in our range, but I didn't do that. I will be looking at slices that are not quite as arbitrary in the future.


The grid points show the Pacific coast and very little to the west of it, but the Caribbean is full of inhabited islands and so we get a lot of grid points there.


Like many tropical regions, the overall change in this time period is very mild compared to the wild fluctuations seen in the polar regions. Still, the general trend is warming, as shown by the median graphed in red dots as usual.


Spring is similar to Winter.


Summer shows the upward trend in every metric. If climate change is considered bad news, the only good news here is that the median rose less than a half degree in 56 years.


Once again, the record highs and lows jump around a little while the median marches steadily upward.

Confidence of the region warming: 99.8%
Confidence of increasing rate: 65.8%
Change in median temperature from the 1955-1975 interval to the 1999-2010 interval: 0.43° C

We can definitely show a warming trend overall, but it is less than a half degree and the rate is getting can't be said to be increasing.


Later today, the last of the Northern Tropics, a corner of South America, a corner of Africa and a lot of the Atlantic.

Tuesday, March 5, 2013

Four weeks of climate data:
Northern Temperate Region #12


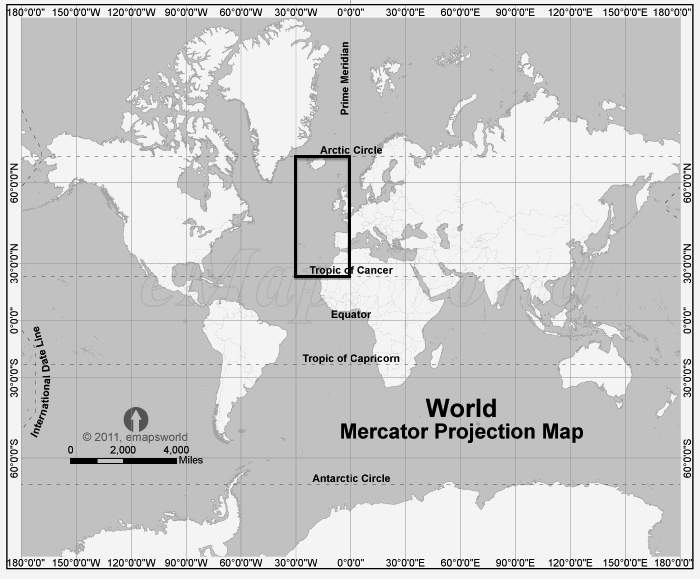
And now the last slice of the Northern Temperate Zone, the northeastern Atlantic with Iceland in the far north to Morocco in the far south. A lot of water, a little land and with the British Isles and Iberia, a substantial population.


Usually I can trace every grid point to some land mass, I assume those three dark grid points in the west are the Azores, but I'm not sure about the solo grid point two rows above it.


The record temperatures for Winter don't show much of a warming trend and rise about a half degree C. from the first time period to the most recent. The median also rises about a half degree and shows a more convincing trend upward. The coolest temperature metric is obviously warming and the overall change is about a degree.


The record highs for Spring only rise half a degree, while the median and low metric increase at about twice that rate.


Summer tells much the same story as Spring.


In the Fall, it's the low temperature metric that is both not consistently increasing and rising much less than even a half degree, while both the record high and median are clearly increasing from interval to interval and rising about a degree.

The final numbers for steps up vs. steps down is 26-10, which means we are over 99.5% confident the temperatures are increasing here. The steps getting taller vs. steps getting shorter is 16-8, which only puts us at 94.8% confident the trend is getting faster.

Tomorrow, a recap of our three regions so far.

Four weeks of climate data:
Northern Temperate Region #11


The next to last slice of the Northern Temperate Zone has a lot of ocean and very little land mass. As we can see on the map, the weather stations on land are at the southern tip of Greenland and the eastern tip of Canada.


You will also notice a grid square near the "#11" here on the coverage map. That dot is the Azores.


The Winter data bounces around a lot, which does not look like a convincing trend. That said, the record high this century is 1 degree C. warmer that the warn experienced in the late 1960s, the median has gone up about a half degree and the low for 1999-2010 is two degrees C. warmer than the lows in the first time period, 1955-1975.


The Spring data does show something like a steady warming trend. More than that, the amount of warming from first era to last is very noticeable. About one and a half degrees in the record high, a degree in the median and two degrees in the low.


In the Summer data, it's the median that increases every era, while both the record highs and lows have one stutter step downward. The record high only rises about a half degree, but the median is up by a degree and a half and the coldest summer of the last era was two degrees warmer than the coldest back in the 1950s.

Two degrees is a Big Damn Deal.

In the Fall data, it's the progress of the lowest temperature that is alarming in every way. It goes up every time we move forward a time interval, every increase is greater than the previous one and total change is about two degrees C.

If more of our metrics looked the bottom black line, that would be real "hair on fire" data, information that could not be denied. But a lot of data looks like the other black line or the red dotted line. Both show increases from first era to last, but they bounce around and the total increase in 56 year is a degree C and possibly less.

That said, we are 95% confident that the temperature is increasing in this region and not 95% confident that the rate is getting faster.

Later today, the last slice of the Northern Temperate Zone, Iceland, the British Isles and Ireland and the Iberian Peninsula.

Saturday, February 9, 2013

In between ideas on climate reports.

People who have been following this blog know that I have spent more than a week talking about how I want to measure climate change in a fair way. I started with Greenland yesterday and promised the Arctic Circle today.

I have had a new idea.


Greenland made some sense as a single island, but my software is designed to look at areas defined by longitude and latitude. What I am going to do is cut the world up into 72 regions and report on them over the time period from 1955 to 2010, the first and last Strong La Niña years in the past 60 years. This map gives us an idea of the straight longitude lines I will use to cut the world into twelve wedges from pole to pole, but my latitude lines will be the Arctic and Tropical lines.


Here is the projection of the Southern Hemisphere from the South Pole. Both the Antarctic Circle and the Tropic of Capricorn are marked.

Here are my six areas defined by latitude.

Northern polar.
Northern temperate.
Northern tropical.
Southern tropical.
Southern temperate.
Southern polar.

To make 72 regions total I slice each latitude region into twelve longitude regions.

0° to 30° West.
30° to 60° West.
60° to 90° West.
90° to 120° West.
120° to 150° West.
150° to 180° West.

0° to 30° East.
30° to 60° East.
60° to 90° East.
90° to 120° East.
120° to 150° East.
150° to 180° East.

Problem #1. Some of these regions are going to be almost entirely ocean and the Berkeley Earth Surface Temperature count stations in a constant position, which is difficult for a seabound weather station. This means some oceanic regions will not get enough coverage to reasonably talk about the numbers being area averages. Tomorrow, we will weed out the areas that can be fairly measured from those that are so sparse we should only look at stations as uniquely representative of their single positions instead of part of a larger chorus.

When I started looking at the data from different polling companies to create the system I now call Confidence of Victory, I had several moments like this when I decided to re-think my measuring system. For most people, the view they have of math is as an unchanging edifice. Mathematicians see it differently, and in this case, you are going to see a story as it is written, draft by draft, instead of a finished product. I hope you enjoy it. it is certainly a lot of fun for me to spend time thinking about it.


Friday, February 8, 2013

Climate Change regional reports #1:
Greenland 1955-2010


And so it begins. I am still new to collecting climate data, so my methods may change over time. Right now, the program I've written takes trends by seasons over an area defined by high and low latitudes and high and low longitudes. On a Mercator projection, this means a rectangle unless the North or South Pole is included. Taken from a pole, a Mercator region will look like a circle or a slice of a pie.

I chose not to take all of Greenland because I wanted to exclude Iceland and parts of eastern Canada. Iceland will be measure on it own in a future post.
 

 While the map looks like a rectangle, the slice will actually be a curved shape. The stations have a clump in the mid lower right, which corresponds to the middle south of the map.  Right now, I do not show that not all regions report all the years in the range. Future versions of this graphic will show how strong a station is by the number of reports it gives.


For example, the clump has a lot of stations that were only temporary. The areas that got the most reporting were in the southwest and the southeast, marked on the map in red.  The next strongest regions are the orange marks in the northeast.  If a region is well covered, it will have 100 diamonds on it. Parts of the middle of Greenland are so remote they have no nearby stations, so those grid points do not even appear.


And now to the reporting of the seasons, starting with winter. The jagged line is the year by year reports. The more blocky lines are the high temperature, median temperature and low temperature for an Oceanic Niña Interval, or ONI for short.  We will be using the 1955 to 2010 range for our work until there is another Strong La Niña or Strong El Niño. The intervals are

1955-1975
1975-1988
1988-1999
1999-2010

 And now the answers to The Two Questions when looking at Greenland Winters.

The trend is Greenland Winters are getting warmer, both the warmest and the coolest.

The most recent interval shows that warming trend in Greenland Winters is not slowing down.


And now the data for Spring.


The trend is Greenland Springs are getting warmer, both the warmest and the coolest, though the rise in the coolest is not as dramatic.

The most recent interval shows that warming trend in Greenland Springs is not slowing down.


And now the data for Summer.

The trend is Greenland Summers are getting warmer, both the warmest and the coolest, though the rise in the warmest is not as dramatic as the Winter increase and the median temperature for 1999-2010 is lower than the median for 1975-1988, the only counterexample in all our measurements for this recent ONI to count as the warmest in more than a half century.

The most recent interval shows that warming trend in Greenland Summers may be alternating. The next Strong La Niña or El Niño year may give us a better idea.


And now the data for Fall.

The trend is Greenland Falls was inconclusive in the first three ONI in our time span, but the most recent showed a dramatic increase in highest temperature, median temperature and lowest temperature.

The most recent interval shows that warming trend in Greenland Falls is not slowing down.


And this brings me to my first important points about terminology. "Global warming" is a bad phrase because not all regions show data as convincing as Greenland. "Climate change" isn't as bad, but it fails to say what the change is.

I propose three categories about regions: Warming regions, static regions and cooling regions. Greenland counts as a warming region.

Tomorrow: The Arctic Circle.