Showing posts with label Antarctica. Show all posts
Tuesday, March 19, 2013
Four weeks of climate data:
Antarctica Temperature Recap
What do the numbers mean? These are the increases in the median temperatures Celsius from the 1955-1975 era to the 1999-2010 era in these six slices of the Antarctica out to 60° South Latitude. That gives as all the Antarctic Peninsula and adds no part of any other continent.
Why the question marks? Using the methodology below of only using grid points with at least 90% of the seasons between 1955 and 2010 reporting, the slice south of Africa and the slice directly opposite had no readings at all.
Why those years? All four of those years are strong La NiƱa years.
What's the methodology? Splitting each slice into a 10 × 10 grid and looking for grid points that reported temperatures in at least 90% of the seasons between 1955 and 2010.
Are these numbers big or small? They are all over the place. The rise of 1.92° C and 2.77° C in the two regions surrounding the Antarctic Peninsula are very large indeed, as is the -1.17° C drop in the region south of the Indian Ocean. There isn't another region in the ones we chose that had a drop that steep.
What's the cause? In the two slices with big increase, the change is albedo, areas where ice on the sea surface melts and exposes more water. Losing oceanic ice does NOT increase sea level, but it does mean more heat is absorbed. This is a feedback loop.
As for the region getting cooler, this may be due to more sea ice than before.
What's the main problem? Melting ice caps in the land mass around the Antarctic Peninsula.
What do humans have to do with this? Once again, greenhouse gases.
For answers to more questions, check out the Arctic recap.
Tomorrow, the temperate zone of the Northern Hemisphere, by far the most populous zone and the most land mass, so it is split into twelve slices instead of just six.
Thursday, March 7, 2013
Four weeks of climate data: Antarctica recap

Instead of looking at the Antarctic Circle, I pushed the boundary out to 60° to encompass the entire continent and add nothing else.
Antarctica Region #1
My first hypothesis on the differences between the Arctic, which shows warming trends everywhere, and Antarctica, which is not cooling nearly as fast, was the discrepancy in the number of humans living there and the number of humans anywhere in the vicinity.
The more sensible theory (theories trump hypotheses) is the difference depends on how much land mass there is covered with ice vs. ocean, some of which has ice and some doesn't. Antarctica is all about the land mass while the Arctic is mainly about ocean.
Confidence of the region warming: 65.8%
Confidence of decreasing rate: 94.8%
Change in median temperature from the 1955-1975 interval to the 1999-2010 interval: 0.36° C
In short, we don't think the region is warming, the rate of warming looks to be slowing and the rise of .36 degrees Celsius is way below the planet average.
Lots of land mass covered with ice, not so much open sea.
Antarctica Region #2
Similar to Region #1, but it has a small ice shelf in that bay.
Confidence of the region warming: less than 50%
Confidence of increasing rate: less than 88%
Change in median temperature from the 1955-1975 interval to the 1999-2010 interval: -0.83° C
This region is cooling, though the trend is not convincing in either direction.
Antarctica Region #3
Confidence of the region warming: about 75%
Confidence of increasing rate: about 63%
Change in median temperature from the 1955-1975 interval to the 1999-2010 interval: 0.24° C
More water than the first two regions, but still not much sign of warming.
No need to link to Region #4. There weren't enough readings from 1955 to 2010 to make any valid judgments about what has happened over that time period. There are more readings over the past twenty years or so, but over the standard time period this blog is looking at we have a blank.
It's too bad because this is a region with very little land mass, a substantial ice shelf in the Ross Sea and plenty of open sea absorbing heat.
Antarctica Region #5
Confidence of the region warming: 99.98%
Confidence of increasing rate: about 89%
Change in median temperature from the 1955-1975 interval to the 1999-2010 interval: 1.95° C
The first region that really looks like serious warming. The land to ocean ratio isn't that much different from some of the regions on the other side of the continent, but the numbers are like night and day.
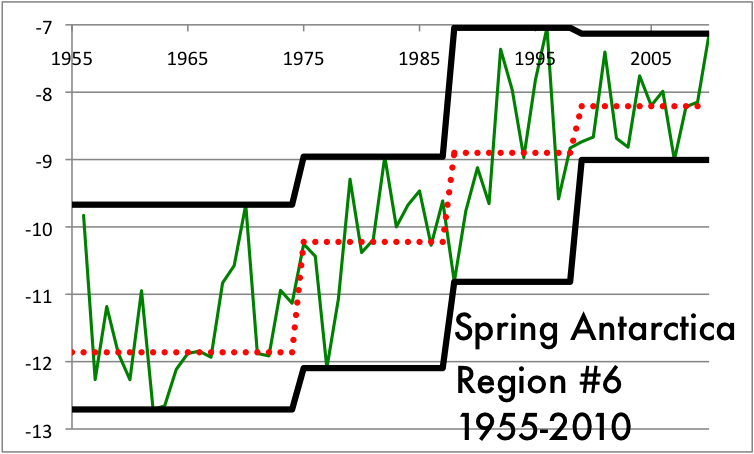
Antarctica Region #6
Confidence of the region warming: 99.999%
Confidence of increasing rate: about 97.9%
Change in median temperature from the 1955-1975 interval to the 1999-2010 interval: 3.39° C
This is the craziest warming region of anything we have seen so far. Whether the big blocks of ice breaking off will float north and melt, which could make a difference in sea level, or if they are pushed by currents to crash back into the continent is anybody's guess. In any case, scientists are keeping a close eye on this very volatile region.
Tomorrow, a recap of the Northern Temperate Zone, the most populated region on earth.
Wednesday, February 27, 2013
Four weeks of climate data:
Antarctica Region #6
The final slice of Western Antarctica has a lot of coverage compared to other regions of the southern continent, though the coverage is paltry compared to the numbers we will see in the Northern Temperate zone, the part of the planet we start looking at tomorrow.
From the grid marks on the coverage map, we see a few consistent stations on the Peninsula, a few on the mainland shore of the Weddell Sea and at least one that is not on dry land at all.
This data shows a general increase, most notably in coldest Summers, and also a tendency that the rate of warming is slowing down.
Fall shows warming in every trend, but those trend appear to be slowing down.
Yet again, the very strong tendencies are towards getting warmer but the rate slowing down.
The number of increases vs. decreases is 31-5, clear evidence the region is getting warmer. But the number of times the next step up is less steep than the prior is 17-7, which makes this the first region where we can say with 95% confidence that the rate of warming is slowing down.
In brief, Antarctica is much more of a mixed bag than the Arctic. There are arguments to be made for warming trends in two of six slices, compared to five of six slices in the Arctic. It also gives some evidence to the hypothesis that if there are a critical mass of people nearby, the world might be going through a cooling trend.
Our next laboratory to test this hypothesis in the Northern Temperate Zone, which includes the most densely populated regions on the globe and a few slices that are mostly ocean and should have minimal numbers of readings. If the populated regions aren't showing warming consistently, this would add to the argument that there is no man-made factor adding to climate change, or if there is it is slight.
We'll start by looking at Region 1 tomorrow, from a southwest corner in the Algerian desert to the Finnish tundra in the northeast.
Stay tuned.
Four weeks of climate data:
Antarctica Region #5
Yesterday evening, we looked at the fourth slice of Antarctica, or failed to look at it may be more precise. That part of the continent has the shoreline in the Ross Sea that is closest to the South Pole. The fifth slice is the part just south of Tierra Del Fuego in South America and contains most of the Antarctic Peninsula. When I was a kid, I thought Antarctica looked like a bird sitting on a nest and the peninsula was like a beak. The thick part of the beak is known as Palmer Land and the Larsen Ice Shelf is tucked in at the curve near the end of the beak on the underside. The Larsen isn't as big as some of the other shelves, but it is the northernmost.
The consistent weather stations are really measuring two grid spaces on the Peninsula. There are weather stations closer to the South Pole, but they aren't consistent over the time period we are looking at.
The record highs of Summer are not getting higher, so the top black line does not show a warming trend. In contrast, both the median and coldest temperatures are showing increase.
The Fall temperatures show the same pattern, not that the warmest season are getting warmer over time, but instead that it's not getting as cold as it used to in the coldest years and the median year is warmer than it used to be.
Winter tells much the same story.
Only in the Spring months do we see new record high warm temperatures in this century. The coldest Spring data trends obviously up, while the median data has a big jump between the 1975-1988 time interval and the 1988-1999 data
There are 36 stair steps in our four seasons of data. 29 go up from left to right, 4 go down and 3 are too close to call. 29 of 36 is way more than half, and using the test that Sir Ronald Fisher developed for a yes/no set of data like this he first used on the experiment known as The Lady Tasting Tea, we can say with about 99.98% confidence this data shows a warming trend.
For increasing warming, we look at the consecutive steps and see if one is taller or shorter than the previous. Here there are 24 pieces of data and our count is 15 taller, 8 shorter and 1 too close to call. 15 of 24 does not get us to the 95% confidence level (closer to 88%) so we can say it is a region showing warming, but not increasing warming. This is the first slice of the southern continent to show a warming trend. Later today, the sixth slice, which has more data reporting than any of our previous regions, including the consistent stations farthest south.
Tuesday, February 26, 2013
Four weeks of climate data:
Antarctica Region #4
The fourth slice of Antarctica has the least land mass of the sections so far and only 17 weather stations total. Since 1955 to 2010 covers 56 years, there are 224 seasons to track. The most seasons any of the weather stayed open for is 90. There is not enough data to make discuss the trends in this area.
To compare this sparse coverage to another part of Antarctica, the first region (the one directly south of Africa and Madagascar) has on 22 weather stations covering a much larger area, but two of those stations were able to give readings in over 190 seasons out of 224, so those grid points gave us useful data.
Tomorrow, we move to the next region, just south of Tierra Del Fuego and the Falkland Islands, a region that has at least two grid points we can use for reliable data.
Four weeks of climate data: Antarctica Region #3
Region #3 of Antarctica is directly south of Australia and New Zealand, but a very long way away from either. As this map shows, Tierra Del Fuego in South America is the closest point to the southern continent, while Australia and New Zealand are farther away and southern Africa and Madagascar are further away still.
Yet again, incredibly sparse coverage of the region, one station on near the Ross Sea shelf and another close to the northern shore.
Summer high records showed a warming trend in the 20th Century, but that was canceled out in the 21st Century. This is a pattern we expect if there is no trend one way or another.
The Fall high temperature records look line a cooling trend based on one warm Fall in the 1950s, which only got data from one of the two weather stations. This is one of those problems with so little coverage. Every other trend looks static.
The Winter high temperatures look to be cooling, but the median and low temperatures look to be warming.
The highs and lows show warming but the median looks fairly static in the Spring readings.
Once again, the null hypothesis must be no trend in either direction and this data doesn't convince us to deny that hypothesis.
Eastern Antarctica has not shown signs of warming over the past 60 years or so.
Later today, the first slice of Western Antarctica, with even less readings than the first three sections of the southern continent.
Monday, February 25, 2013
Four weeks of climate data:
Antarctica Region #2
Continuing in the Eastern half of Antarctica, as remote from humans as any part of the planet can get.
At least this region gets coverage every year from 1955 to 2010 and has 4 of the 100 grid points checking in. Still, this is very desolate, even compared to the Arctic Circle.
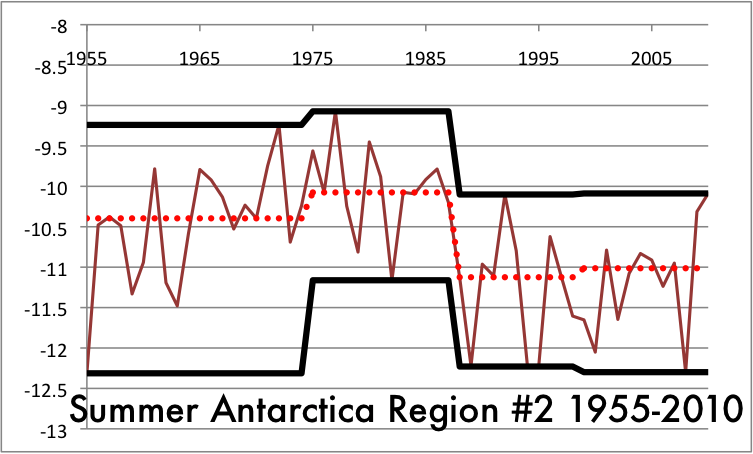
The Summer clear does not show a warming trend. In fact, the record highs and the median would argue this part of Antarctica is actually cooling.
The median in Fall shows some cooling trend, the highs and lows look relatively static. This kind of bouncing around is what we expect in a time interval that is not changing significantly.
Except that the coldest Winter this century was a lot warmer than cold Winters last century, this data looks like a cooling pattern.
There hasn't been a warm Spring to match the record set in the 1970s, but the last interval this century showed a slight uptick.
Once again, if the null hypothesis is no significant change, there is not enough data to dispute it, either as a warming trend or a cooling trend.
Tomorrow, the last Eastern Hemisphere slice and the first Western Hemisphere part.
Four weeks of climate data:
Antarctica Region #1
Welcome to Antarctica. Population: You and the pilot who brought you.
As we will see, most of Antarctica is not being studied and getting reliable data over our time period of 1955 to 2010, two years that had strong La NƱia currents, is going to be problematic.
In every region we will look at, the program I've written cuts it up into a 10 × 10 grid. In this time period, we get only two grid points giving us data.
In the Arctic, even a sparsely covered region like Greenland gave us nine grid points. When we get to the Northern Temperate Zone, coverage will be close to universal everywhere on dry land.
There were no consistent station giving information from 1955 to 1959, so our era starts in 1960. We start in Summer because January is the first full Summer month south of the equator. This data actually shows a cooling trend.
The Fall trend looks a bit more like warming.
Winter again shows a modest warming trend.
Spring on the other hand looks like it's static or slightly cooling.
If our null hypothesis is there is no significant change, this data does not let us say with any confidence this region is either warming or cooling.
It would be nice if we had more data, but we aren't allowed to make it up. This kind of sparse coverage and unconvincing data are going to be par for the course on the coldest continent.
This evening, Region #2.
Four weeks of climate data: Six regions for Antarctica
The second slice of the globe we will look at is Antarctica. In the northern polar region, I made the Arctic Circle the cut off line, but in the south I move the region out to the 60° Southern Latitude so the whole of the southern continent is included and nothing else.
We start at 0° Longitude and move east to 60° Longitude East for the first region.
60° to 120° Longitude east.
The third slice gets part of the inlet known as the Ross Sea.
Slice #4 is the first part of Western Antartica.
Antarctica has an effective population density of zero people per square mile, even less than Greenland. There's nobody there and there many nearby populated land masses. This region has the closest distance, about 800 miles across Drake's Passage to Tierra Del Fuego, some of the coldest, choppiest seas in the world.
Region 6 has another large inlet called the Weddell Sea. The Weddell and Ross Seas are home to the largest of the ice shelves that surround the place.
Later today, we look at the first and second slices, with some surprising results in terms of climate data.
Subscribe to:
Posts (Atom)