
The final slice of Western Antarctica has a lot of coverage compared to other regions of the southern continent, though the coverage is paltry compared to the numbers we will see in the Northern Temperate zone, the part of the planet we start looking at tomorrow.

From the grid marks on the coverage map, we see a few consistent stations on the Peninsula, a few on the mainland shore of the Weddell Sea and at least one that is not on dry land at all.

This data shows a general increase, most notably in coldest Summers, and also a tendency that the rate of warming is slowing down.

Fall shows warming in every trend, but those trend appear to be slowing down.

Yet again, the very strong tendencies are towards getting warmer but the rate slowing down.
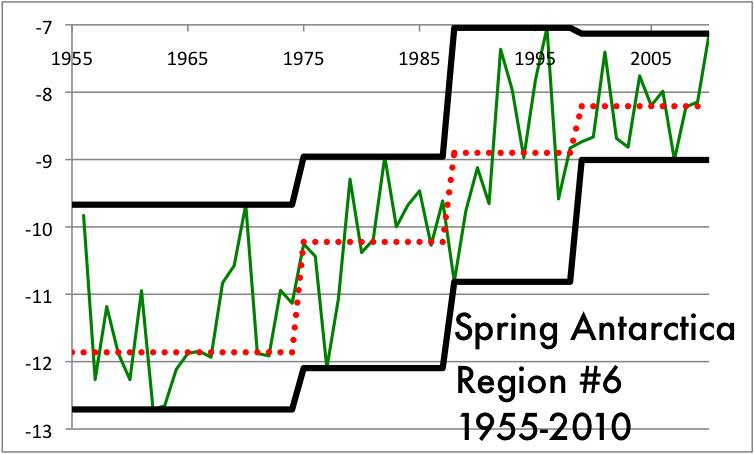
The number of increases vs. decreases is 31-5, clear evidence the region is getting warmer. But the number of times the next step up is less steep than the prior is 17-7, which makes this the first region where we can say with 95% confidence that the rate of warming is slowing down.
In brief, Antarctica is much more of a mixed bag than the Arctic. There are arguments to be made for warming trends in two of six slices, compared to five of six slices in the Arctic. It also gives some evidence to the hypothesis that if there are a critical mass of people nearby, the world might be going through a cooling trend.
Our next laboratory to test this hypothesis in the Northern Temperate Zone, which includes the most densely populated regions on the globe and a few slices that are mostly ocean and should have minimal numbers of readings. If the populated regions aren't showing warming consistently, this would add to the argument that there is no man-made factor adding to climate change, or if there is it is slight.
We'll start by looking at Region 1 tomorrow, from a southwest corner in the Algerian desert to the Finnish tundra in the northeast.
Stay tuned.
No comments:
Post a Comment