
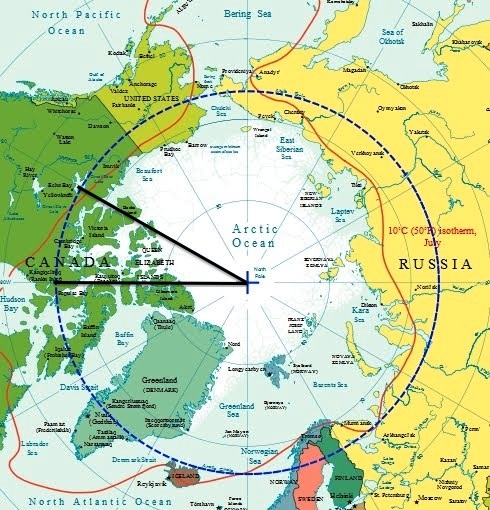
Welcome to the first post of a set of data I am calling Six Weeks Of Climate Data. Sundays are going to be Map Days. The six latitudinal slices are:
Week 1: Arctic Polar Zone
Week 2: Antarctic Polar Zone
Week 3: Northern Temperate Zone
Week 4: Southern Temperate Zone
Week 5: Northern Tropical Zone
Week 6: Southern Tropical Zone
Each of these zones is split into twelve longitudinal slices. On Monday through Saturday, two slices a day will be discussed at length.

Region 1
On map: Northern Scandinavia, Svalbard Island
Number of readings: 12,867
This is more than double the readings of any other region, though many other regions have a lot more land mass above the Arctic Circle, a huge amount of the data is from northern Scandanavia, but the Norwegians also have a lot of stations on Svalbard Island, the island in blue in the middle of the slice.

Region 2
On map: Barents Sea, Franz-Josef-Land, Nowaja Selija
Number of readings: 5,593
The northernmost islands are Franz-Josef-Land. This map has them in blue and says Norway has jurisdiction, but other sources say the islands belong to Russia.

On map: Kara Sea, Nowaja Selija
Number of readings: 5,190
As we travel east across Russia, the number of readings decrease.

On map: Severnaya Zemlya Islands, Taymyr Peninsula
Number of readings: 3,282

On map: Laptev Sea, New Siberian Islands
Number of readings: 3,099

On map: East Siberian Sea
Number of readings: 1,515
Very little land, very few readings.

Region 7
On map: End of Russia, beginning of Alaska
Number of readings: 3,603
The amount of land is not that much more than Region 6, but the number of readings goes way up. The Alaskans are doing more work than the Siberians would be the obvious inference.

Region 8
On map: Beaufort Sea
Number of readings: 4,945
Before this post becomes too jingoistic, it looks like the northern Canadians are more interested in climate data than the Alaskans. While nowhere near the most land mass of the Western hemisphere slices, by far the most readings.
On map: Queen Elizabeth Islands
Number of readings: 3,441
A lot more land mass than Region 8, somewhat less than Region 10, but less readings than either.

Region 10
On map: Baffin Bay, Baffin Island, western Greenland
Number of readings: 4,160
The second most readings of the Western Hemisphere and a large clump of land near the pole.

Region 11
On map: central Greenland
Number of readings: 2,160
The slice with far and away the most polar land mass, the number of readings in the all Greenland slice does not speak well of Danish in comparison to the work done by the Canadians right next door.

Region 12
On map: eastern Greenland
Number of readings: 1,588
A much smaller land mass than region 12, but more than region 6, the only region with less readings.
C'mon, Denmark! Time to show a little pride about what's happening on that big chunk of polar real estate you own!
Enough with the nation chiding and praise. Tomorrow we start looking at what's going on in these slices of the Arctic over the time period defined by Strong Oceanic Niña Interval years 1955 and 2010.
No comments:
Post a Comment