The second region of the Southern Temperate Zone is the Indian Ocean with a few scattered islands.
There were only readings from a few islands, and the only weather station that kept consistent readings from 1955 to 2010 was on the French controlled island Kerguelen.
As I said earlier, this "temperate zone" is cold. This is down in The Fifties and Summer average temperatures wander between 3° C to 7° C. For Americans, that's between 37.4° F and 44.6° F.
Cold. The coldest metric shows an increase, but the median and high show that the 90s were a little warmer than the first decade of this century.
The Fall numbers look similar to Summer, only more so, the 90s warmer that The Oughts.
Winter's pattern is different. Generally we see an increase across all metrics, but very little overall.
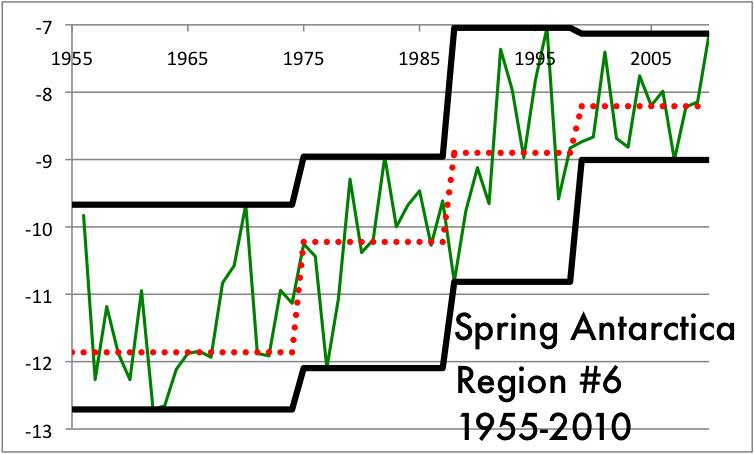
Spring is like Winter, but all the metrics show the big jump between the 1955-1975 era and the 1975-1988 period.
Confidence of the region warming: 99%
Confidence of decreasing rate: 97.9%
Change in median temperature from the 1955-1975 interval to the 1999-2010 interval: 0.55° C
One island in an expanse of ocean, but it counts as a region. It's warming but the rate is slowing down and the level of warming over 56 years is not particularly alarming.
Tomorrow, Australia and New Zealand lumped together in the third region then the gap between New Zealand and South America as Region #4.
Showing posts with label slowing rate of warming. Show all posts
Saturday, March 16, 2013
Wednesday, March 13, 2013
Four weeks of climate data:
Southern Tropics Region #2
This region is smaller than other slices of the Southern Tropics, but it is interesting nonetheless. El Niño/La Niña is important over a vast stretch of the world, but here almost more than anywhere. The varying temperature expanse of water stretches out across the Indian and Pacific Oceans but is somewhat larger in the Indian, so this region with as few people as possible and adjacent to this huge cause of what we look at as the randomness of climate gives us a pretty good idea what would be happening if people were out of the equation.
As you can see, there are three grid points out of a possible 100 feeding us equally consistent data for all 56 years. The lower left point is probably Rodriguez and the point at the right is likely Diego Garcia. I am not sure what island the other weather station represents.
Summer, which is the Southern Hemisphere starts just before Chirstmas, shows a warming trend. If not for the record warn Summer in the late 1990s, every metric would show warming that is slowing down.
The Fall looks much like Summer, except cooler and slightly flatter increases.
If you are not certain what I mean when I say "warming but slowing down", Winter in this region is the perfect example. Every step from left to right is a step up, but every step is less steep than the one before it when reading from left to right.
Spring, like Summer and Fall, has one peak in the late 1990s that keeps from being warming in every trend.
Confidence of the region warming: 99.999%
Confidence of decreasing rate: 99.9%
Change in median temperature from the 1955-1975 interval to the 1999-2010 interval: 0.66° C
I would argue that this region, as small as it is, tells us what the world would be doing if it didn't have a species that was clever enough to burn the world to keep itself warm, and in the 20th Century showed that it is clever enough to keep itself cool. (Air conditioning.) The world would likely be warming, the rate would be slowing down and at least over the water, the rate would be going up about 1% of a degree Celsius per year, maybe a little less in regions that aren't in the middle of El Niño/La Niña Central.
Tomorrow morning, we look at Indonesia, New Guinea and tropical Australia.
As you can see, there are three grid points out of a possible 100 feeding us equally consistent data for all 56 years. The lower left point is probably Rodriguez and the point at the right is likely Diego Garcia. I am not sure what island the other weather station represents.
Summer, which is the Southern Hemisphere starts just before Chirstmas, shows a warming trend. If not for the record warn Summer in the late 1990s, every metric would show warming that is slowing down.
The Fall looks much like Summer, except cooler and slightly flatter increases.
If you are not certain what I mean when I say "warming but slowing down", Winter in this region is the perfect example. Every step from left to right is a step up, but every step is less steep than the one before it when reading from left to right.
Spring, like Summer and Fall, has one peak in the late 1990s that keeps from being warming in every trend.
Confidence of the region warming: 99.999%
Confidence of decreasing rate: 99.9%
Change in median temperature from the 1955-1975 interval to the 1999-2010 interval: 0.66° C
I would argue that this region, as small as it is, tells us what the world would be doing if it didn't have a species that was clever enough to burn the world to keep itself warm, and in the 20th Century showed that it is clever enough to keep itself cool. (Air conditioning.) The world would likely be warming, the rate would be slowing down and at least over the water, the rate would be going up about 1% of a degree Celsius per year, maybe a little less in regions that aren't in the middle of El Niño/La Niña Central.
Tomorrow morning, we look at Indonesia, New Guinea and tropical Australia.
Monday, March 11, 2013
Four weeks of climate data:
Northern Tropics Region #4
Even at full magnification of this map, the fourth region of the Northern Tropics looks empty, but looking carefully at the top middle, you will see a few dots that represent the Hawai'ian Islands.
There is one other island in the part of the Pacific that has a reliable weather station, and that is the American protectorate Johnson Island.
The patterns of the four season in Hawai'i all look about the same. There was a general warming trend in the last half of the 20th Century, but things dropped off in the first decade of the 21st.
Even with the drop-off, the median in the 1999-2010 era is slightly higher that the median for 1955-1975.
The story is repeated again.
The big difference between Fall and the other season is how consistent the record high temperature has stayed.
Confidence of the region warming: 90.8%
Confidence of decreasing rate: 99.9%
Change in median temperature from the 1955-1975 interval to the 1999-2010 interval: 0.14° C
We can't definitely show a warming trend overall, but it is extremely mild and the rate is getting absolutely getting slower.
Tomorrow, it's the last two parts of the Western Hemisphere's sections of the northern tropics, the first part dominated by Central America and the second part combining a little of the Guyanas in South America with a part of West Africa.
There is one other island in the part of the Pacific that has a reliable weather station, and that is the American protectorate Johnson Island.
The patterns of the four season in Hawai'i all look about the same. There was a general warming trend in the last half of the 20th Century, but things dropped off in the first decade of the 21st.
Even with the drop-off, the median in the 1999-2010 era is slightly higher that the median for 1955-1975.
The story is repeated again.
The big difference between Fall and the other season is how consistent the record high temperature has stayed.
Confidence of the region warming: 90.8%
Confidence of decreasing rate: 99.9%
Change in median temperature from the 1955-1975 interval to the 1999-2010 interval: 0.14° C
We can't definitely show a warming trend overall, but it is extremely mild and the rate is getting absolutely getting slower.
Tomorrow, it's the last two parts of the Western Hemisphere's sections of the northern tropics, the first part dominated by Central America and the second part combining a little of the Guyanas in South America with a part of West Africa.
Four weeks of climate data:
Northern Tropics Region #3
The third slice of the Northern Tropics is the Pacific Ocean on the Asian side of the International Date line.
There are islands dotting this region, but I am not certain why the easternmost column is so well represented. There are either weather stations on a bunch of very small islands from the Philippines up to Japan or some of those stations are actually at sea.
The general Winter trend is upward, but the range of change from warmest to coldest is only about one and a half degrees C.
Spring shows a warming trend, again over a very limited range. Also, the big jump was between the 1955-1975 era to the 1975-1988. The rate here looks like it's slowing down.
Summer is very much like Spring, warming but slowing down, a very small range of temperatures.
The only point of disagreeing data in Fall is that the record high was over 20 years ago.
Confidence of the region warming: 99.9%
Confidence of decreasing rate: 97.9%
Change in median temperature from the 1955-1975 interval to the 1999-2010 interval: 0.52° C
We can definitely show a warming trend overall, but it is not particularly severe and the rate is getting slower.
Later today, the Western Hemisphere slice of the tropical Pacific, which means we are taking the temperature of Hawaii.
There are islands dotting this region, but I am not certain why the easternmost column is so well represented. There are either weather stations on a bunch of very small islands from the Philippines up to Japan or some of those stations are actually at sea.
The general Winter trend is upward, but the range of change from warmest to coldest is only about one and a half degrees C.
Spring shows a warming trend, again over a very limited range. Also, the big jump was between the 1955-1975 era to the 1975-1988. The rate here looks like it's slowing down.
Summer is very much like Spring, warming but slowing down, a very small range of temperatures.
The only point of disagreeing data in Fall is that the record high was over 20 years ago.
Confidence of the region warming: 99.9%
Confidence of decreasing rate: 97.9%
Change in median temperature from the 1955-1975 interval to the 1999-2010 interval: 0.52° C
We can definitely show a warming trend overall, but it is not particularly severe and the rate is getting slower.
Later today, the Western Hemisphere slice of the tropical Pacific, which means we are taking the temperature of Hawaii.
Sunday, March 3, 2013
Four weeks of climate data:
Northern Temperate Region #8
Here is the region nearest and dearest to my heart, Northern Temperate Region #8. I have lived in Northern California almost all my life - taught for a term in El Salvador, tried a semester at University of Miami (FL), so I'm interested in how the climate has changed here.
Of course, the biggest mass of land in this slice in north of the U.S.-Canada border, so this does not truly tell the story of my back yard.
As you can see, this region is covered almost completely wherever there is land mass, but they are a few gaps in the north in Canada near the Arctic Circle.
The story of warming here is a mixed bag. The lowest temperature metric is all uphill and rose by about two degrees since the 1950s, but the median rises by about a degree since the beginning and the record high happened over thirty years ago.
The Spring data shows warming in general, but only about a half degree in over fifty years in all three of our measurement systems.
Summer show a warming tendency, but once again the amount of warming is not impressive, about a half degree from start to finish.
Fall shows warming fairly steadily and strongly. Each of our three measurement systems show at least a degree and a half increase Celsius, the low temperature closer to two.
The data gives two pieces of information that might seem contradictory to some people.
1. We are 99.5% confident the region is warming.
2. We are 95% confident that the rate of warming is slowing down.
Remember that in most seasons, the amount of warming is small but relatively steady. Only the Fall increase gives us much call for alarm. But in many regions and by many ways of measuring, the big jump up happened early and later moves were not as steep upwards or may have even moved backwards.
Tomorrow, we cover regions #9 and #10, the bulk of the United States and Canada and northern Mexico.
Stay tuned.
Wednesday, February 27, 2013
Four weeks of climate data:
Antarctica Region #6
The final slice of Western Antarctica has a lot of coverage compared to other regions of the southern continent, though the coverage is paltry compared to the numbers we will see in the Northern Temperate zone, the part of the planet we start looking at tomorrow.
From the grid marks on the coverage map, we see a few consistent stations on the Peninsula, a few on the mainland shore of the Weddell Sea and at least one that is not on dry land at all.
This data shows a general increase, most notably in coldest Summers, and also a tendency that the rate of warming is slowing down.
Fall shows warming in every trend, but those trend appear to be slowing down.
Yet again, the very strong tendencies are towards getting warmer but the rate slowing down.
The number of increases vs. decreases is 31-5, clear evidence the region is getting warmer. But the number of times the next step up is less steep than the prior is 17-7, which makes this the first region where we can say with 95% confidence that the rate of warming is slowing down.
In brief, Antarctica is much more of a mixed bag than the Arctic. There are arguments to be made for warming trends in two of six slices, compared to five of six slices in the Arctic. It also gives some evidence to the hypothesis that if there are a critical mass of people nearby, the world might be going through a cooling trend.
Our next laboratory to test this hypothesis in the Northern Temperate Zone, which includes the most densely populated regions on the globe and a few slices that are mostly ocean and should have minimal numbers of readings. If the populated regions aren't showing warming consistently, this would add to the argument that there is no man-made factor adding to climate change, or if there is it is slight.
We'll start by looking at Region 1 tomorrow, from a southwest corner in the Algerian desert to the Finnish tundra in the northeast.
Stay tuned.
Subscribe to:
Posts (Atom)