People who have been following this blog know that I have spent more than a week talking about how I want to measure climate change in a fair way. I started with Greenland yesterday and promised the Arctic Circle today.
I have had a new idea.
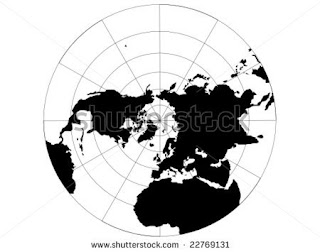
Greenland made some sense as a single island, but my software is designed to look at areas defined by longitude and latitude. What I am going to do is cut the world up into 72 regions and report on them over the time period from 1955 to 2010, the first and last Strong La Niña years in the past 60 years. This map gives us an idea of the straight longitude lines I will use to cut the world into twelve wedges from pole to pole, but my latitude lines will be the Arctic and Tropical lines.
Here is the projection of the Southern Hemisphere from the South Pole. Both the Antarctic Circle and the Tropic of Capricorn are marked.
Here are my six areas defined by latitude.
Northern polar.
Northern temperate.
Northern tropical.
Southern tropical.
Southern temperate.
Southern polar.
To make 72 regions total I slice each latitude region into twelve longitude regions.
0° to 30° West.
30° to 60° West.
60° to 90° West.
90° to 120° West.
120° to 150° West.
150° to 180° West.
0° to 30° East.
30° to 60° East.
60° to 90° East.
90° to 120° East.
120° to 150° East.
150° to 180° East.
Problem #1. Some of these regions are going to be almost entirely ocean and the Berkeley Earth Surface Temperature count stations in a constant position, which is difficult for a seabound weather station. This means some oceanic regions will not get enough coverage to reasonably talk about the numbers being area averages. Tomorrow, we will weed out the areas that can be fairly measured from those that are so sparse we should only look at stations as uniquely representative of their single positions instead of part of a larger chorus.
When I started looking at the data from different polling companies to create the system I now call Confidence of Victory, I had several moments like this when I decided to re-think my measuring system. For most people, the view they have of math is as an unchanging edifice. Mathematicians see it differently, and in this case, you are going to see a story as it is written, draft by draft, instead of a finished product. I hope you enjoy it. it is certainly a lot of fun for me to spend time thinking about it.

