Showing posts with label The statistical world. Show all posts

Sunday, May 5, 2013

The statistical world: Part 5, assessing risks


Assessing risk is very difficult and it is a question that confronts us at all turns. In some cases, government has decided to penalize people who take some risks. You have to wear a seat belt while driving and you have to have proof of insurance. Both of these actions are penalized by fines. Driving under the influence can be a fine or can be jail time.

Smoking outside of designated areas can cost you money in this day and age as well, as can selling cigarettes or alcohol to minors. Governments around the country have taxed cigarettes much more heavily than other products.

The question is: just how dangerous is it to smoke? This is a difficult question to answer and the answer must be stated in statistical ways, which is to say we do not have proof like we have in mathematics, but instead confidence levels and correlations.

This means it is possible for a smoker to live to be 90 and die from some cause not related to smoking, just as it is possible for someone who quits smoking and exercises regularly to die at the age of 52 like Dr. Jim Fixx, a physician who advocated a life of regular strenuous exercise.


Here is a simple metaphor, and I admit it is likely too simple. Think of life as a game. The rules are just about the same for everyone, but we are all rolling our own set of dice. Certain risks are so big that you are opting for a set of dice that really do hate you, if I may borrow a joke from the great nerd cartoonist John Kovalic.

Still, there is wild variation. John Banner, the actor who played Sgt. Schultz on Hogan's Heroes, died just a few years after the series was over at the age of 63 from am abdominal hemorrhage. It would be easy and likely fair to blame him early death on his weight. But consider Leon Askin, another fat actor from Hogan's Heroes. He was big all his life and lived to be 97.

(Two other coincidences in the lives of Banner and Askin. Both were Austrian Jews. One part of that is not such a coincidence, since the regular actors playing German soldiers and/or Nazis on Hogan's Heroes were Jewish.)

This randomness is often used by people who want to downplay the risks of smoking, many of them in the pay of the tobacco industry, others addicts of the product. Among the addicts who likely took no cash from the tobacco industry to complain about the unfair restrictions on their habit are the great statistician Sir Ronald Fisher, the novelist and strong believer in evil government ineptness Ayn Rand and the musician and composer Joe Jackson, not to be confused with the father of The Jackson Five and daughters Janet and LaToya.
   

Which brings us to climate change. Again, this is a matter of statistical risk, not certain mathematical risk. Many of the arguments against any human cause for a warming climate have a stance similar to the arguments against links between smoking and human health risks. More than analogies, many people who were in the pay of the tobacco lobby are now in the pay of the petroleum industry.

To steal a joke from a friend who is a public defender, these people sell reasonable doubt at a reasonable price.

Regular readers will know I took a few months on this blog to look at climate data and came to the conclusion that the climate is changing and in the great majority of places, the climate is warming, in some places at catastrophic rates. As for human causes, to accept this we have to pile statistics upon statistics.  That said, the model for the increase in CO2 is a much better predictor than most statistical models and is showing no signs of slowing down as humans continue to consider their addiction to fossil fuels a God given right.

Again to quote Mr. Kovalic, when it comes to the climate, our dice really do hate us. It's time for all of us to try to do what we can to change the set of dice that will determine the future for the generations that will still be here when we are gone.

Thursday, May 2, 2013

The Statistical World, part 4

From late 2011 through November 2012, my main math hobby was keeping track of the election data. On the morning of election day, I made a prediction as to how things would turn out in the 51 electoral college races (all 50 states and DC) and the 33 Senate races. I was using a mathematical system which gave a favorite in 83 of the 84 races and called one race (electoral college in Florida) a toss-up. I flipped a mental coin and gave Florida to Romney.

It turns out I'm not fantastic at flipping mental coins. Obama barely beat Romney in Florida. But in the other 83 races, my system picked the winner every time.

Nate Silver of the New York Times also made predictions in all 84 of these races. His system also called Florida a toss-up, which is a credit to both of us, but also a little lucky. In other elections, my system has called a race a toss-up and one side or the other won handily. In the other 83 races, Nate went 81-2, missing two Senate races in Montana and North Dakota, two results that my system got right.


So if we include my guessing call of Florida, I went 83-1 and Nate went 81-2. Our percentages are 98.8% and 97.6% respectively, both of which count as excellent when it comes to prognostication.

Are we geniuses or what?


Well, I'm going to say "or what". The general election polling data was non-stop for several months. Looking back at my records, there were 700 polls dealing with the 84 races in the last five weeks of the race. I started keeping daily track of the median electoral college result after Obama's disastrous first debate appearance, and his numbers did suffer. But then came the Biden-Ryan debate and second Obama-Romney debate and Romney finally repudiating his "47% comment" and the Obama advantage moved up to where it had been as of early October.  It was hard to pick winners because the races were not very close and the opinions were not taking huge swings, just small ones.


Here is the best data that shows Silver and I are not geniuses and that is the primary election season. This graph shows the ups and downs of the four candidates still in the race in February, Mitt Romney (green), Newt Gingrich (gray), Rick Santorum (brown) and Ron Paul (gold). I also tracked NONE OF THE ABOVE in black.

There were a lot of polls during this month, but not anywhere near the number there were in the general election. More than that, the Republican electorate was in an amazing state of flux. You can see Santorum climbed from third place to first place then back down to second in the space of four weeks. More than that, NONE OF THE ABOVE was holding steady at about 15% throughout the month.

In the primaries that month, Nate and I weren't scoring in the 98th or 99th percentiles. The data was sketchier and our predictions suffered. Predictions from polling data is a lot more accurate than predicting the results of sporting events, to give just one example, but even taking the average (or median) of a lot of polls can be shaky, especially when NONE OF THE ABOVE is well over 10% this close to the election.

Nate's book The Signal and the Noise is a study of why some predictions do well and others do not. He thinks that in the long run we are going to learn how to do better in general. I'm not convinced. Sometimes, the randomness inherent in a system will overwhelm the cleverest human prediction methods.


Sunday, April 28, 2013

The Statistical World: Part 3, life and death


When discussing probabilities, the two common measurement systems are ratios and percents. A ratio would be written as 1 chance in 3 or a probability of 1/3. The same number as a percent would round to 33% or possibly 33.3%, which as a fraction would be 33/100 or 33.3/100. Going past a tenth of a percent in rounding is rare.

When discussing death statistics, the usual time period is a year and the usual scale is per 100,000 population. The most likely causes of death for all adults are heart disease and cancer, both currently slightly under 200 deaths be 100,000 population in the United States, according to The New England Journal of Medicine.

Heart disease is dropping quickly as a cause of death. In 1960, it killed 369 of every 100,000 people, nearly twice the rate we see today. Cancer, on the other hand, is rising slowly. It went from 149 of 100,000 in 1960 to 186 of 100,000 in 2010. The general consensus is that we are seeing more cancer deaths because people are living longer and not dying of other diseases.

And then there is death by violence. In the general population, it is a much smaller risk than the major diseases. In 2010, accidents caused 38.2 deaths per 100,000 population, making it the fifth most common killer. The only other death by violence in the top ten these days is suicide at 12.2 per 100,000. The murder rate is much lower.

I show a picture of a gun here because of the noticeable dichotomy in suicide rates between men and women. Women's suicide rate is less than 5 per 100,000 while men's rates about 19 per 100,000. That would seem to say men are about four times more likely to kill themselves than women are, but that is not the entire picture. When looking at reported suicide attempts, women try to kill themselves at a rate three times greater than men's. Multiplying three by four, this means a man attempting suicide is twelve times more likely to succeed than a woman.

Men attempting suicide are much more likely to use a gun than women are. For all the fear we have of mass killers, the biggest public safety problem concerning guns happens alone behind closed doors.


I apologize here midway through this post for morbidness, but it is about to get worse. Now we look at infant mortality, babies born alive but not surviving to a first birthday. Instead of being counting on the scale of 100,000, infant mortality is counted per 1,000 live births.

In 1960, infant mortality was much worse than it is today, even in industrialized nations. The United States was losing 26 of every 1,000 babies, which would round  2.6% By reports I have seen, it was significantly worse in 1956, the year infant mortality mattered to me personally, though I was blissfully unaware.

Unaware, but not untouched. When I was a baby, I contracted bronchialitis, an inflammation of the small blood vessels in the lung. There have been attempts to find a cure, but now as then, for the most part this is a watch and wait situation. I was fed through a tube in my heel and - spoiler alert - I survived. The scar, once very noticeable, is now high up on my ankle.

This graph shows six countries arbitrarily chosen from among the industrialized world: France, Ireland, Sweden, Switzerland, the United Kingdom and the United States. Even in 1960, we were not "number one", as we so often have been taught to think of ourselves. Now we are in sixth place out of these six. 

This is not random chance. Every country we think of as being "advanced" or "industrialized" does a better job of keeping babies alive. The countries we compete with are like Croatia and other Eastern European still trying to catch up after decades of living under backward Communist rule. (Notice that the countries ahead of us all practice what is called socialism by American standards.)

Infant mortality is a difficult and complex subject. It is getting better, even in the worst places, but even in the best places that are around 2 per 1,000 live births lost, that would multiply out to 200 per 100,000. it's as bad as heart disease is for the general population.

Infant mortality is not part of the general conversation in this country. It should be and it should not be a cause of conflict culture, one political side against another. We have the means to do better. We only need to add the political will.


Saturday, April 27, 2013

The Statistical World: Part 2


As someone who use to gamble much more than I do now,  I have a visceral understanding of probability that non-gamblers do not have.

For example, if we reach this position in a game of backgammon, here are the odds of winning.

If it's black's turn: game over. Black wins 100% of the time.

If it's White's turn: There are exactly 19 rolls that win and 17 rolls that lose. It's a little better than flipping a fair coin, which would be 50%-50%. This rounds to 52.8% chance to win and a 47.2% chance to lose.

The only thing to question is if "fair dice" exist, or even "fair coins". Lots of data has been compiled and the answer is yes. Most coins in your pocket will come up heads when flipped about 50% of the time, and most dice have a roughly even distribution of the six possible numbers.


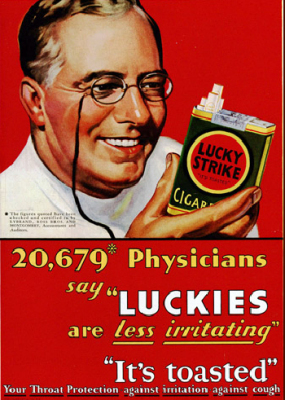
And then there is randomness in the real world. if you saw the first episode of Mad Men, you might recall that the Surgeon General's 1960 report on the effects of smoking and the subsequent publishing in Reader's Digest was a major plot point. To drive home the point that Don Draper is not just a pretty face, he comes up with the Lucky Strike slogan "It's toasted" on the spot when pitching to the worried owners.

If fact, the slogan is real and pre-dates the 1960 advertising crisis by several years. Mad Men's first episode gets several things right, including that the tobacco industry would be barred from using testimonials from doctors or even dentists in the years to come.

But what are the exact probabilities of cigarette smoking causing you harm and shortening your life? Here the numbers get hazy. Many different factors can be considered other than smoking, some that make things better and some that make things worse. It is about as far as you can get from an exact science, but serious experts take randomness into account and still claim smoking has multiple ways it can screw up your health, many of them very significant changes for the worse indeed.

Tomorrow, we talk about the randomness.

Friday, April 26, 2013

The statistical world: Part 1


We live in a statistical world. What I mean is that for most of the decisions we face, there are some choices that are better than others, but they do not guarantee success or even that minimal level of success, breaking even.

Tic-tac-toe is part of the mathematical world. In the mathematical world we have proof, a guarantee of success or a guarantee of failure. If two player are at the maximum skill level in tic-tac-toe, every game is a draw, because the first player puts his or her mark in the center and the second player puts the opposite mark in one of the four corners.

Not every game in the mathematical world ends in a draw. In the simple number game "How much money does your dad make?", the first player names a number and the second player can always name a higher number. There are other simple games where going second is a forced win, like certain variations of Nim.
 

Yahtzee is the commercial name for a game that has been around for a long time. It is more involved than tic-tac-toe, but at the end of the 20th Century computer scientists "solved" the game, meaning they found the optimal play in every possible situation, meaning every possible roll with even possible combination of scores you have already achieved. If you were to match two computers perfectly programmed, you would not expect a draw in every game. In fact, actual tie scores should be extremely rare. What you would expect in the very long run is that both sides would win equal numbers of games, regardless of who played first or second. (Yahtzee is really a solitaire game, though usually played in groups. My dice rolls do not effect yours and vice versa, though some players might make decisions because they are ahead or behind late in a particular game that they would not make in a true solitaire game.

Even though we know the best way to play, it does not insure victory or even a draw every time. Randomness is so great in Yahtzee that the best possible strategy might lose to some other strategy if both players are promised to roll the same values in all cases until the game ends.

This is what I mean by the statistical world. Risks and rewards may or may not be completely understood, but even if we know the odds down to exact values, randomness can produce very strange results. Tomorrow, I will discuss the idea of assessing risk, something we do not always do very well.