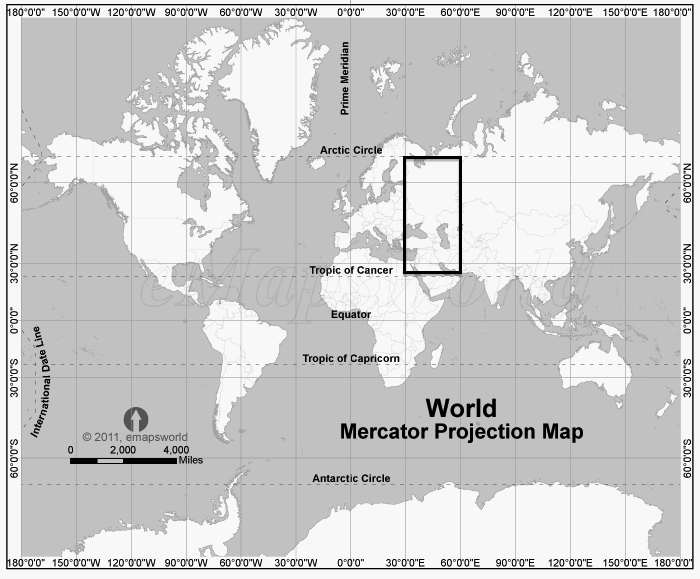
As a general rule, it would be fair to say that the most extreme warming is happening in the Arctic Circle and Western Antarctica. The Western Antarctic warm zone doesn't seem to be radiating out much heat to nearby areas, which is not surprising when you see how far away anything "nearby the Antarctic really is and when you consider the harsh seas and skies that surround the South Pole.
The Southern Tropics have no slice that gets near our somewhat arbitrary level of 1° C rise in temperature over the 56 year period we have chosen to look at, based on Strong La Niña currents.
Tomorrow, our last region, the southern temperate zone, with even more water and less land mass than the southern tropics.
Showing posts with label recap. Show all posts
Thursday, March 21, 2013
Four weeks of climate data: Northern Tropics Temperature Recap
Because there is less land mass and more ocean, I split the regions other than the Northern Temperate Zone into six sections instead of twelve. As you can see, only the section including Africa and Arabia are showing significant warming. I think it makes sense for me to do some more region testing based on specific areas that are defined by climate and ecosystem, and the Sahara is certainly one of those regions.
The last two slices of the planet, the Southern tropic and Temperate Zones, will be recapped tonight and tomorrow.
Wednesday, March 20, 2013
Four weeks of climate data:
Northern Temperate Western Hemisphere Temperature Recap
The Western Hemisphere of the Northern Temperate Zone doesn't have as much land or as many people as the Eastern Hemisphere of the same zone, and the temperatures aren't as quite as warm. Still, the region is warming noticeably over the 56 year period, in this case only using grid points that have reports from 90% of the seasons between Winter 1955 and Fall 2010.
Tomorrow, I will continue the trip south through both tropical zones. On Friday, I will finish with the Southern Temperate Zone.
I'm working on a new idea of how to look at the data which I call De-Niñoization. The idea is to subtract the El Niño-La Niña effects from each season to see if the data fits a linear regression better. My guess is that we could see improvement in regions close to the temperature anomaly which spreads across the Indian and Pacific Oceans, radiating in strength from close to the equator, but likely less helpful when we look at regions far from the warming water. My test case will be tropical India vs. Greenland, where we would expect the Indian data to become very nearly linear while the Greenland data might become even more erratic.
Tomorrow, I will continue the trip south through both tropical zones. On Friday, I will finish with the Southern Temperate Zone.
I'm working on a new idea of how to look at the data which I call De-Niñoization. The idea is to subtract the El Niño-La Niña effects from each season to see if the data fits a linear regression better. My guess is that we could see improvement in regions close to the temperature anomaly which spreads across the Indian and Pacific Oceans, radiating in strength from close to the equator, but likely less helpful when we look at regions far from the warming water. My test case will be tropical India vs. Greenland, where we would expect the Indian data to become very nearly linear while the Greenland data might become even more erratic.
Four weeks of climate data:
Northern Temperate Eastern Hemisphere Temperature Recap
I changed the method of accepting data for this recap. Previously, if a grid point on my map reported 75% of the time, I considered it reliable and added it to total from which the averages were taken. I saw this was a problem in some of the very sparsely covered regions, like the Indian Ocean region that only had two islands reporting, one much warmer than the other. Today, I re-sampled the data for the Northern Temperate Zone and increased the reporting threshold to 90% of the time. This increased the temperature readings in some regions, decreased it in others, and evened the data out considerably. The number represents the difference in the median of the era 1999-2010 and the era 1955-1975. The years are chosen because all of them were strong La Niña years.
With these readings, the consensus is clear. This region, easily the most populous in the world, went up about a degree Celsius over a 56 year time span, 1955-2010. I am not certain why the second section shows so much more warming than the rest. I'll split it up into smaller parts to see if the north or the south is making the difference.
According to climatologists, the unexploded time bomb in this region is a permafrost located in Siberia, some of it in the Arctic and some in the temperate. "Perma" is relative, but this particular chunk has been ice for about 10,000 years and covers an area equal to France and Germany combined. If this melts, and it has started, the effect is not just albedo (frost reflects heat, land absorbs more) but the amount of carbon dioxide that will be released as the ice becomes water and the bubbles trapped in the ice are released into the atmosphere.
To be clear, this region is not warming at the pace of the Arctic Circle, but it is warming consistently if we look at the data from the most consistently reporting weather stations. Later today, we will look at the numbers from the Western Hemisphere, again relying on the grid points that report at least 90% of the time.
Tuesday, March 19, 2013
Four weeks of climate data:
Antarctica Temperature Recap
What do the numbers mean? These are the increases in the median temperatures Celsius from the 1955-1975 era to the 1999-2010 era in these six slices of the Antarctica out to 60° South Latitude. That gives as all the Antarctic Peninsula and adds no part of any other continent.
Why the question marks? Using the methodology below of only using grid points with at least 90% of the seasons between 1955 and 2010 reporting, the slice south of Africa and the slice directly opposite had no readings at all.
Why those years? All four of those years are strong La Niña years.
What's the methodology? Splitting each slice into a 10 × 10 grid and looking for grid points that reported temperatures in at least 90% of the seasons between 1955 and 2010.
Are these numbers big or small? They are all over the place. The rise of 1.92° C and 2.77° C in the two regions surrounding the Antarctic Peninsula are very large indeed, as is the -1.17° C drop in the region south of the Indian Ocean. There isn't another region in the ones we chose that had a drop that steep.
What's the cause? In the two slices with big increase, the change is albedo, areas where ice on the sea surface melts and exposes more water. Losing oceanic ice does NOT increase sea level, but it does mean more heat is absorbed. This is a feedback loop.
As for the region getting cooler, this may be due to more sea ice than before.
What's the main problem? Melting ice caps in the land mass around the Antarctic Peninsula.
What do humans have to do with this? Once again, greenhouse gases.
For answers to more questions, check out the Arctic recap.
Tomorrow, the temperate zone of the Northern Hemisphere, by far the most populous zone and the most land mass, so it is split into twelve slices instead of just six.
Four weeks of climate data:
Arctic Circle Temperature Recap
It's time for a visit from my blog partner, Hypothetical Question Asker.
What do the numbers mean? These are the increases in the median temperatures Celsius from the 1955-1975 era to the 1999-2010 era in these six slices of the Arctic Circle.
Why those years? All four of those years are strong La Niña years.
What's the methodology? Splitting each slice into a 10 × 10 grid and looking for grid points that reported temperatures in at least 90% of the seasons between 1955 and 2010.
Are these numbers big or small? These numbers are hella big, as we say in Oakland. One degree in 56 years is a Big Damn Deal and the smallest number here is 1.38° C.
What's the cause? In most of the slices, the big change is albedo, areas where ice on the sea surface melts and exposes more water. Losing oceanic ice does NOT increase sea level, but it does mean more heat is absorbed. This is a feedback loop.
What's the main problem? Melting ice caps in the land mass close to the pole, most notably Greenland but also the northernmost islands of Canada.
What do humans have to do with this? Greenhouse gases are our main contribution to the mix as far as the Arctic is concerned. Carbon dioxide (CO2), which is measured in parts per billion in the atmosphere, is at an unprecedented level. The thing is, the earth's climate is a very big thing that doesn't evenly distribute anything.
If CO2 levels are higher than ever, why aren't temperatures higher than ever? That is a fair question. Not every system increases linearly. For example, gravity increases linearly when mass is increased, but decreases by the reciprocal of the square when distance increases. Other systems only increase by the square root or fourth root of some important variable. The greenhouse gas model hasn't been pushed to this level before, so maybe we will find out a linear increase isn't in the cards. In this case, slower would be better.
Is global warming to blame for Katrina or Sandy or the droughts in the Midwest? Here, the predictive model doesn't state that exactly. The most that climate scientists can say is the odds of certain things happening seem to be on the rise and that rise is definitely noticeable. For example, there are events called "100 year storms", based on the idea they can be expected to happen every 100 years. In some parts of the globe, the odds of the "100 year storm" have increased so much that they might now be fairly called "10 year storms" or even "5 year storms".
Later today, a similar recap for Antarctica.
What do the numbers mean? These are the increases in the median temperatures Celsius from the 1955-1975 era to the 1999-2010 era in these six slices of the Arctic Circle.
Why those years? All four of those years are strong La Niña years.
What's the methodology? Splitting each slice into a 10 × 10 grid and looking for grid points that reported temperatures in at least 90% of the seasons between 1955 and 2010.
Are these numbers big or small? These numbers are hella big, as we say in Oakland. One degree in 56 years is a Big Damn Deal and the smallest number here is 1.38° C.
What's the cause? In most of the slices, the big change is albedo, areas where ice on the sea surface melts and exposes more water. Losing oceanic ice does NOT increase sea level, but it does mean more heat is absorbed. This is a feedback loop.
What's the main problem? Melting ice caps in the land mass close to the pole, most notably Greenland but also the northernmost islands of Canada.
What do humans have to do with this? Greenhouse gases are our main contribution to the mix as far as the Arctic is concerned. Carbon dioxide (CO2), which is measured in parts per billion in the atmosphere, is at an unprecedented level. The thing is, the earth's climate is a very big thing that doesn't evenly distribute anything.
If CO2 levels are higher than ever, why aren't temperatures higher than ever? That is a fair question. Not every system increases linearly. For example, gravity increases linearly when mass is increased, but decreases by the reciprocal of the square when distance increases. Other systems only increase by the square root or fourth root of some important variable. The greenhouse gas model hasn't been pushed to this level before, so maybe we will find out a linear increase isn't in the cards. In this case, slower would be better.
Is global warming to blame for Katrina or Sandy or the droughts in the Midwest? Here, the predictive model doesn't state that exactly. The most that climate scientists can say is the odds of certain things happening seem to be on the rise and that rise is definitely noticeable. For example, there are events called "100 year storms", based on the idea they can be expected to happen every 100 years. In some parts of the globe, the odds of the "100 year storm" have increased so much that they might now be fairly called "10 year storms" or even "5 year storms".
Later today, a similar recap for Antarctica.
Saturday, March 9, 2013
Four weeks of climate data:
Northern Temperate Zone, Western Hemisphere recap
Northern Temperate region #7
Confidence of the region warming: just over 50%
Confidence of increasing rate: 50%
Change in median temperature from the 1955-1975 interval to the 1999-2010 interval: 0.79° C
A lot of water usually shows a strong warming trend, just as very little water usually does not. The correlation isn't perfect.
Northern Temperate region #8
Confidence of the region warming:under 99.5%
Confidence of decreasing rate: 94.6%
Change in median temperature from the 1955-1975 interval to the 1999-2010 interval: 1.01° C
Here is an odd region. Very confident of warming, a big jump from the first time interval to the last, but the trends say the warming is slowing down.
If you are of the opinion that global warming is a "We're all screwed" situation, the fact this region is slowing down is a glimmer of hope.
Especially for me since I live in this region.
Northern Temperate region #9
Confidence of the region warming:over 95%
Confidence of increasing rate: 50%
Change in median temperature from the 1955-1975 interval to the 1999-2010 interval: 0.80° C
Another big landlocked region does not show a degree change in more than a half century and no sign of an increasing warming trend.
But it is warming.
Northern Temperate region #10
Confidence of the region warming: over 95%
Confidence of increasing rate: 88.9%
Change in median temperature from the 1955-1975 interval to the 1999-2010 interval: 0.90° C
It's warming, it could be speeding up though we aren't sure and it's close to a degree in 56 years but not quite.
None of that is really good news.
Northern Temperate region #11
Confidence of the region warming: 97.7%
Confidence of increasing rate: 79.2%
Change in median temperature from the 1955-1975 interval to the 1999-2010 interval: 1.01° C
Another region with more than a degree change in 56 years, strong confidence in warming but the confidence in increasing is not strong. With very little land and a lot of water we expect to see warming.
Northern Temperate region #12
Confidence of the region warming: over 99.5% Confidence of increasing rate: 94.8%
Change in median temperature from the 1955-1975 interval to the 1999-2010 interval: 0.81° C
Another region with a lot of water, with land ranging from Iceland to Morocco. It's clearly warming, it might well be increasing and it's closer to a degree of warming than it is to a half degree. Not a lot of good news.
Tomorrow, we start looking again at new territory, splitting the Northern Tropical Zone into six slices, the first slice dominated by the Sahara.
Friday, March 8, 2013
Four weeks of climate data:
Northern Temperate Zone, Eastern Hemisphere recap
Northern Temperate region #1
Confidence of the region warming:under 50%
Confidence of increasing rate: under 50%
Change in median temperature from the 1955-1975 interval to the 1999-2010 interval: 1.06° C
The temperature in this part of Europe with a little North Africa thrown in is bouncing around from time interval to time interval, but the median rose over a point from the first time interval to the last. That number is in italics because it's a Big Damn Deal.
Northern Temperate region #2
Confidence of the region warming: over 99%
Confidence of increasing rate: over 95%
Change in median temperature from the 1955-1975 interval to the 1999-2010 interval: 1.54° C
This region of the Northern Temperate Zone in the Eastern Hemisphere is showing more warming than any other. The general correlation of "more water means more warming" isn't perfect but it's very good. This is one of the counterexamples that keeps it from being perfect.
Northern Temperate region #3
Confidence of the region warming: 74.5%
Confidence of increasing rate: 88.9%
Change in median temperature from the 1955-1975 interval to the 1999-2010 interval: 0.32° C
This region is the first of two landlocked parts of Asia that show relatively little warming.
Northern Temperate region #4
Confidence of the region warming: 74.8%
Confidence of increasing rate: 50.0%
Change in median temperature from the 1955-1975 interval to the 1999-2010 interval: 0.67° C
An argument by the people who deny any human cause of climate change is that the region that includes heavily populated and still growing China is not showing a lot of warming this past half century.
A counterargument to this is that the amount of ocean surface in a region is a better indicator of warming and this slice is almost completely landlocked.
Northern Temperate region #5
Confidence of the region warming: 97.7%
Confidence of increasing rate: 50%
Change in median temperature from the 1955-1975 interval to the 1999-2010 interval: 0.77° C
As we reach the Pacific we see more warming than we did in the two large but landlocked sections of Asia.
Northern Temperate region #6
Confidence of the region warming: 99.6%
Confidence of increasing rate: 50%
Change in median temperature from the 1955-1975 interval to the 1999-2010 interval: 0.85° C
More water and more warming than Region #5, but .85 of a degree Celsius in 56 years is not a "hair on fire" number.
Tomorrow, we look at the Western Hemipshere half of the the Northern Temperate Zone.
Thursday, March 7, 2013
Four weeks of climate data: Antarctica recap

Instead of looking at the Antarctic Circle, I pushed the boundary out to 60° to encompass the entire continent and add nothing else.
Antarctica Region #1
My first hypothesis on the differences between the Arctic, which shows warming trends everywhere, and Antarctica, which is not cooling nearly as fast, was the discrepancy in the number of humans living there and the number of humans anywhere in the vicinity.
The more sensible theory (theories trump hypotheses) is the difference depends on how much land mass there is covered with ice vs. ocean, some of which has ice and some doesn't. Antarctica is all about the land mass while the Arctic is mainly about ocean.
Confidence of the region warming: 65.8%
Confidence of decreasing rate: 94.8%
Change in median temperature from the 1955-1975 interval to the 1999-2010 interval: 0.36° C
In short, we don't think the region is warming, the rate of warming looks to be slowing and the rise of .36 degrees Celsius is way below the planet average.
Lots of land mass covered with ice, not so much open sea.
Antarctica Region #2
Similar to Region #1, but it has a small ice shelf in that bay.
Confidence of the region warming: less than 50%
Confidence of increasing rate: less than 88%
Change in median temperature from the 1955-1975 interval to the 1999-2010 interval: -0.83° C
This region is cooling, though the trend is not convincing in either direction.
Antarctica Region #3
Confidence of the region warming: about 75%
Confidence of increasing rate: about 63%
Change in median temperature from the 1955-1975 interval to the 1999-2010 interval: 0.24° C
More water than the first two regions, but still not much sign of warming.
No need to link to Region #4. There weren't enough readings from 1955 to 2010 to make any valid judgments about what has happened over that time period. There are more readings over the past twenty years or so, but over the standard time period this blog is looking at we have a blank.
It's too bad because this is a region with very little land mass, a substantial ice shelf in the Ross Sea and plenty of open sea absorbing heat.
Antarctica Region #5
Confidence of the region warming: 99.98%
Confidence of increasing rate: about 89%
Change in median temperature from the 1955-1975 interval to the 1999-2010 interval: 1.95° C
The first region that really looks like serious warming. The land to ocean ratio isn't that much different from some of the regions on the other side of the continent, but the numbers are like night and day.
Antarctica Region #6
Confidence of the region warming: 99.999%
Confidence of increasing rate: about 97.9%
Change in median temperature from the 1955-1975 interval to the 1999-2010 interval: 3.39° C
This is the craziest warming region of anything we have seen so far. Whether the big blocks of ice breaking off will float north and melt, which could make a difference in sea level, or if they are pushed by currents to crash back into the continent is anybody's guess. In any case, scientists are keeping a close eye on this very volatile region.
Tomorrow, a recap of the Northern Temperate Zone, the most populated region on earth.
Wednesday, March 6, 2013
Four weeks of climate data: Arctic Circle recap
We have now looked at three of the six slices of the planet's surface, so this is pretty much halftime in the presentation. I thought it made sense to give a recap of the data so far, starting with the Arctic Circle.
Arctic Circle Region #1
Confidence of the region warming: 99.8%
Confidence of increasing rate: 97.9%
Change in median temperature from the 1955-1975 interval to the 1999-2010 interval: 1.55° C
When numbers are in bold, this means they are significant. Rising more than a degree in about 56 years is serious.
Arctic Circle Region #2
Confidence of the region warming: 99%
Confidence of increasing rate: under 50%
Change in median temperature from the 1955-1975 interval to the 1999-2010 interval: 2.19° C
Arctic Circle Region #3
Confidence of the region warming: 97.7%
Confidence of increasing rate: 99.7%
Change in median temperature from the 1955-1975 interval to the 1999-2010 interval: 2.91° C
Arctic Circle Region #4
Confidence of the region warming: 99.9%
Confidence of increasing rate: at 50%
Change in median temperature from the 1955-1975 interval to the 1999-2010 interval: 2.36° C
Arctic Circle Region #5
Confidence of the region warming: 99.9%
Confidence of increasing rate: 65%
Change in median temperature from the 1955-1975 interval to the 1999-2010 interval: 1.94° C
Arctic Circle Region #6
Confidence of the region warming: 95%
Confidence of increasing rate: 65%
Change in median temperature from the 1955-1975 interval to the 1999-2010 interval: 0.83° C
The big takeaway: The Arctic is warming like crazy. The worldwide change in temperature in this era is less than a degree. In the Arctic, only Greenland is warming that slowly.
My first hypothesis was about people and the relative lack of them in Greenland. The real difference is albedo, the difference between ice reflecting heat and water absorbing it. The Greenland ice layer is much more constant that the ice sheet on the Arctic Ocean.
Thursday, a re-cap of the Antarctic, a place like Greenland but more so, a massive ice sheet mainly lying above solid ground.
Subscribe to:
Posts (Atom)