Showing posts with label Northern Temperate zone. Show all posts

Wednesday, March 20, 2013

Four weeks of climate data:
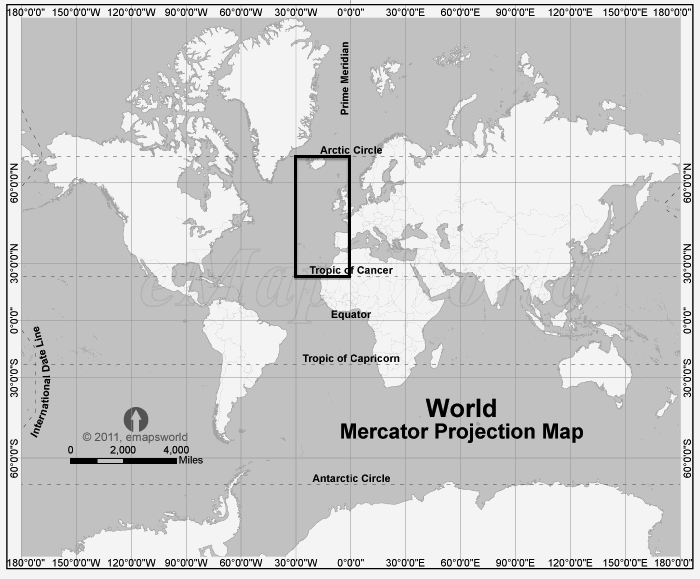
Northern Temperate Western Hemisphere Temperature Recap

The Western Hemisphere of the Northern Temperate Zone doesn't have as much land or as many people as the Eastern Hemisphere of the same zone, and the temperatures aren't as quite as warm. Still, the region is warming noticeably over the 56 year period, in this case only using grid points that have reports from 90% of the seasons between Winter 1955 and Fall 2010.

Tomorrow, I will continue the trip south through both tropical zones. On Friday, I will finish with the Southern Temperate Zone.

I'm working on a new idea of how to look at the data which I call De-Niñoization. The idea is to subtract the El Niño-La Niña effects from each season to see if the data fits a linear regression better. My guess is that we could see improvement in regions close to the temperature anomaly which spreads across the Indian and Pacific Oceans, radiating in strength from close to the equator, but likely less helpful when we look at regions far from the warming water. My test case will be tropical India vs. Greenland, where we would expect the Indian data to become very nearly linear while the Greenland data might become even more erratic.

Four weeks of climate data:
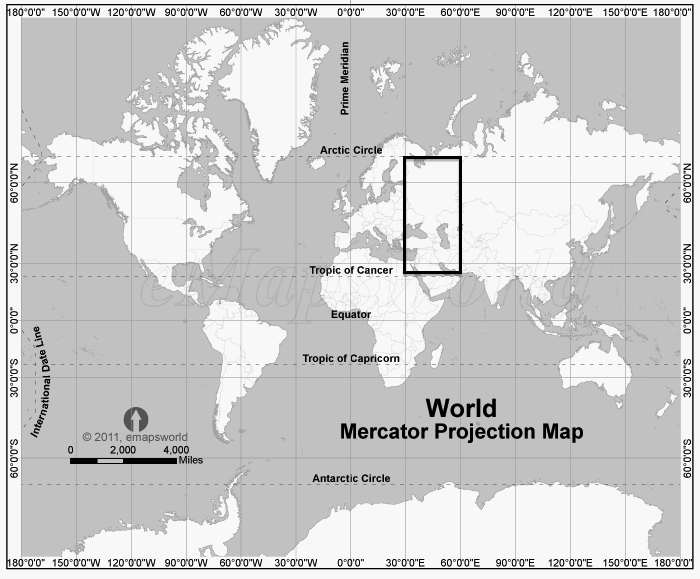
Northern Temperate Eastern Hemisphere Temperature Recap


I changed the method of accepting data for this recap. Previously, if a grid point on my map reported 75% of the time, I considered it reliable and added it to total from which the averages were taken.  I saw this was a problem in some of the very sparsely covered regions, like the Indian Ocean region that only had two islands reporting, one much warmer than the other. Today, I re-sampled the data for the Northern Temperate Zone and increased the reporting threshold to 90% of the time. This increased the temperature readings in some regions, decreased it in others, and evened the data out considerably. The number represents the difference in the median of the era 1999-2010 and the era 1955-1975. The years are chosen because all of them were strong La Niña years.


With these readings, the consensus is clear. This region, easily the most populous in the world, went up about a degree Celsius over a 56 year time span, 1955-2010. I am not certain why the second section shows so much more warming than the rest. I'll split it up into smaller parts to see if the north or the south is making the difference.

According to climatologists, the unexploded time bomb in this region is a permafrost located in Siberia, some of it in the Arctic and some in the temperate. "Perma" is relative, but this particular chunk has been ice for about 10,000 years and covers an area equal to France and Germany combined. If this melts, and it has started, the effect is not just albedo (frost reflects heat, land absorbs more) but the amount of carbon dioxide that will be released as the ice becomes water and the bubbles trapped in the ice are released into the atmosphere.

To be clear, this region is not warming at the pace of the Arctic Circle, but it is warming consistently if we look at the data from the most consistently reporting weather stations.  Later today, we will look at the numbers from the Western Hemisphere, again relying on the grid points that report at least 90% of the time.

Saturday, March 9, 2013

Four weeks of climate data:
Northern Temperate Zone, Western Hemisphere recap


Northern Temperate region #7

Confidence of the region warming: just over 50%
Confidence of increasing rate: 50%
Change in median temperature from the 1955-1975 interval to the 1999-2010 interval: 0.79° C


A lot of water usually shows a strong warming trend, just as very little water usually does not. The correlation isn't perfect.


Northern Temperate region #8

Confidence of the region warming:under 99.5%
Confidence of decreasing rate: 94.6%
Change in median temperature from the 1955-1975 interval to the 1999-2010 interval: 1.01° C

Here is an odd region. Very confident of warming, a big jump from the first time interval to the last, but the trends say the warming is slowing down.

If you are of the opinion that global warming is a "We're all screwed" situation, the fact this region is slowing down is a glimmer of hope.

Especially for me since I live in this region.


Northern Temperate region #9

Confidence of the region warming:over 95%
Confidence of increasing rate: 50%
Change in median temperature from the 1955-1975 interval to the 1999-2010 interval: 0.80° C


Another big landlocked region does not show a degree change in more than a half century and no sign of an increasing warming trend.


But it is warming.


Northern Temperate region #10

Confidence of the region warming: over 95%
Confidence of increasing rate: 88.9%
Change in median temperature from the 1955-1975 interval to the 1999-2010 interval: 0.90° C


It's warming, it could be speeding up though we aren't sure and it's close to a degree in 56 years but not quite.


None of that is really good news.


Northern Temperate region #11

Confidence of the region warming: 97.7%
Confidence of increasing rate: 79.2%
Change in median temperature from the 1955-1975 interval to the 1999-2010 interval: 1.01° C

Another region with more than a degree change in 56 years, strong confidence in warming but the confidence in increasing is not strong. With very little land and a lot of water we expect to see warming.


Northern Temperate region #12

Confidence of the region warming: over 99.5% Confidence of increasing rate: 94.8%
Change in median temperature from the 1955-1975 interval to the 1999-2010 interval: 0.81° C

Another region with a lot of water, with land ranging from Iceland to Morocco. It's clearly warming, it might well be increasing and it's closer to a degree of warming than it is to a half degree.  Not a lot of good news.

Tomorrow, we start looking again at new territory, splitting the Northern Tropical Zone into six slices, the first slice dominated by the Sahara.


Friday, March 8, 2013

Four weeks of climate data:
Northern Temperate Zone, Eastern Hemisphere recap


Northern Temperate region #1

Confidence of the region warming:under 50%
Confidence of increasing rate: under 50%
Change in median temperature from the 1955-1975 interval to the 1999-2010 interval: 1.06° C

The temperature in this part of Europe with a little North Africa thrown in is bouncing around from time interval to time interval, but the median rose over a point from the first time interval to the last.  That number is in italics because it's a Big Damn Deal.


Northern Temperate region #2

Confidence of the region warming: over 99%
Confidence of increasing rate: over 95%
Change in median temperature from the 1955-1975 interval to the 1999-2010 interval: 1.54° C

This region of the Northern Temperate Zone in the Eastern Hemisphere is showing more warming than any other. The general correlation of "more water means more warming" isn't perfect but it's very good. This is one of the counterexamples that keeps it from being perfect.


Northern Temperate region #3

Confidence of the region warming: 74.5%
Confidence of increasing rate:  88.9%
Change in median temperature from the 1955-1975 interval to the 1999-2010 interval: 0.32° C

This region is the first of two landlocked parts of Asia that show relatively little warming.


Northern Temperate region #4

Confidence of the region warming: 74.8%
Confidence of increasing rate: 50.0%
Change in median temperature from the 1955-1975 interval to the 1999-2010 interval: 0.67° C

An argument by the people who deny any human cause of climate change is that the region that includes heavily populated and still growing China is not showing a lot of warming this past half century.

A counterargument to this is that the amount of ocean surface in a region is a better indicator of warming and this slice is almost completely landlocked.

Northern Temperate region #5

Confidence of the region warming: 97.7%
Confidence of increasing rate: 50%
Change in median temperature from the 1955-1975 interval to the 1999-2010 interval: 0.77° C

As we reach the Pacific we see more warming than we did in the two large but landlocked sections of Asia.

Northern Temperate region #6

Confidence of the region warming: 99.6%
Confidence of increasing rate: 50%
Change in median temperature from the 1955-1975 interval to the 1999-2010 interval: 0.85° C

More water and more warming than Region #5, but .85 of a degree Celsius in 56 years is not a "hair on fire" number.

Tomorrow, we look at the Western Hemipshere half of the the Northern Temperate Zone.

Tuesday, March 5, 2013

Four weeks of climate data:
Northern Temperate Region #12


And now the last slice of the Northern Temperate Zone, the northeastern Atlantic with Iceland in the far north to Morocco in the far south. A lot of water, a little land and with the British Isles and Iberia, a substantial population.


Usually I can trace every grid point to some land mass, I assume those three dark grid points in the west are the Azores, but I'm not sure about the solo grid point two rows above it.


The record temperatures for Winter don't show much of a warming trend and rise about a half degree C. from the first time period to the most recent. The median also rises about a half degree and shows a more convincing trend upward. The coolest temperature metric is obviously warming and the overall change is about a degree.


The record highs for Spring only rise half a degree, while the median and low metric increase at about twice that rate.


Summer tells much the same story as Spring.


In the Fall, it's the low temperature metric that is both not consistently increasing and rising much less than even a half degree, while both the record high and median are clearly increasing from interval to interval and rising about a degree.

The final numbers for steps up vs. steps down is 26-10, which means we are over 99.5% confident the temperatures are increasing here. The steps getting taller vs. steps getting shorter is 16-8, which only puts us at 94.8% confident the trend is getting faster.

Tomorrow, a recap of our three regions so far.

Four weeks of climate data:
Northern Temperate Region #11


The next to last slice of the Northern Temperate Zone has a lot of ocean and very little land mass. As we can see on the map, the weather stations on land are at the southern tip of Greenland and the eastern tip of Canada.


You will also notice a grid square near the "#11" here on the coverage map. That dot is the Azores.


The Winter data bounces around a lot, which does not look like a convincing trend. That said, the record high this century is 1 degree C. warmer that the warn experienced in the late 1960s, the median has gone up about a half degree and the low for 1999-2010 is two degrees C. warmer than the lows in the first time period, 1955-1975.


The Spring data does show something like a steady warming trend. More than that, the amount of warming from first era to last is very noticeable. About one and a half degrees in the record high, a degree in the median and two degrees in the low.


In the Summer data, it's the median that increases every era, while both the record highs and lows have one stutter step downward. The record high only rises about a half degree, but the median is up by a degree and a half and the coldest summer of the last era was two degrees warmer than the coldest back in the 1950s.

Two degrees is a Big Damn Deal.

In the Fall data, it's the progress of the lowest temperature that is alarming in every way. It goes up every time we move forward a time interval, every increase is greater than the previous one and total change is about two degrees C.

If more of our metrics looked the bottom black line, that would be real "hair on fire" data, information that could not be denied. But a lot of data looks like the other black line or the red dotted line. Both show increases from first era to last, but they bounce around and the total increase in 56 year is a degree C and possibly less.

That said, we are 95% confident that the temperature is increasing in this region and not 95% confident that the rate is getting faster.

Later today, the last slice of the Northern Temperate Zone, Iceland, the British Isles and Ireland and the Iberian Peninsula.

Monday, March 4, 2013

Four weeks of climate data:
Northern Temperate Region #10


The tenth slice of the Northern Temperate Zone is the eastern United States and Canada with the Great Lakes as the westernmost cut-off point.


The region is very well coverage with weather stations on dry land. The one reporting grid point out in the middle of the Atlantic is Bermuda.


Winter lows showed a downward trend until this century, while the record highs went down then up sharply then down slightly.  Only the median shows stead warming.

The record highs and median have both risen about a degree C over the time span, the record lows less than a half degree.


All three metrics have one step down and two steps up. The record lows have risen more than one degree C, the record highs slightly less than a degree and the median about a half degree.


Steady rise in the median metric, but only about a half degree up from the first to last interval.  The record lows have risen a full degree, the record highs much less than a half degree, but that is only because of one very warm Summer in 1955.


Fall shows a down-up-up pattern in both the record highs and record lows. Both the record high and median temperature half risen a full degree, while the record low is up a remarkable two degrees C.

The steps upward yet again overwhelm the steps downward and we are 95% confident we are looking at a warming trend. The data for getting increasingly warm split 15-9 faster to slower. It takes 17-7 for us to be 95% confident this is warming at an increasing rate.

Tomorrow, we journey into the North Atlantic for Region #11 (South tip of Greenland and the easternmost part of Canada) and Region #12 (Iceland, Ireland, the U.K. and the Iberian peninsula.)

Four weeks of climate data:
Northern Temperate Region #9


Today, we start with Region #9 in the Northern Temperate Zone. It includes almost all the United States west of the Great Lakes, a large swatch of western and central Canada and much of northern Mexico.

The missing grid points are mostly because of that part of the region being water instead of land. The gap in the upper middle is because that region of Canada is so sparsely populated.


Winter shows a general warming pattern, with just one stutter step down in each of our three measurement systems. The record low increased by a degree and a half Celsius from the first time interval to the last, while the high and median increases are closer to a degree.


In Spring, again just one step down in each of the metrics vs. two steps up.  Here it's the record high that jumps a degree and a half, while the median and low show just modest gains.
 

In Summer, the two steps upward and one step downward trend continues. The thing to note is that none of our measurement systems shows even a degree climb upward in 56 years. The evidence of warming is strong, but the amount is modest.


Again, we get enough upward steps vs. downward steps (23-12) to say with 95% confidence this is a warming region. We cannot say the region is warming faster over time.

Later today, Region #10, almost all the Atlantic coast of the U.S. and Canada and most of Hudson Bay.

Sunday, March 3, 2013

Four weeks of climate data:
Northern Temperate Region #8


Here is the region nearest and dearest to my heart, Northern Temperate Region #8. I have lived in Northern California almost all my life - taught for a term in El Salvador, tried a semester at University of Miami (FL), so I'm interested in how the climate has changed here.

Of course, the biggest mass of land in this slice in north of the U.S.-Canada border, so this does not truly tell the story of my back yard.


As you can see, this region is covered almost completely wherever there is land mass, but they are a few gaps in the north in Canada near the Arctic Circle.


The story of warming here is a mixed bag. The lowest temperature metric is all uphill and rose by about two degrees since the 1950s, but the median rises by about a degree since the beginning and the record high happened over thirty years ago.


The Spring data shows warming in general, but only about a half degree in over fifty years in all three of our measurement systems.


Summer show a warming tendency, but once again the amount of warming is not impressive, about a half degree from start to finish.


Fall shows warming fairly steadily and strongly. Each of our three measurement systems show at least a degree and a half increase Celsius, the low temperature closer to two.

The data gives two pieces of information that might seem contradictory to some people.

1. We are 99.5% confident the region is warming.

2. We are 95% confident that the rate of warming is slowing down.

Remember that in most seasons, the amount of warming is small but relatively steady. Only the Fall increase gives us much call for alarm. But in many regions and by many ways of measuring, the big jump up happened early and later moves were not as steep upwards or may have even moved backwards.

Tomorrow, we cover regions #9 and #10, the bulk of the United States and Canada and northern Mexico.

Stay tuned.


Four weeks of climate data:
Northern Temperate Region #7


The seventh slice of the Northern Temperate Zone is the first in the Western Hemisphere moving from west to east. It includes a very small part of Russia and most of the populated part of Alaska, a term I used advisedly.


Alaska is definitely not Antarctica. There are people there and we get weather readings from all over the state.


The Winter data shows the record warm season was in this century, but there is no consistent trend of warming or cooling when looking at all three yardsticks.


The Spring data again looks like it bounces around randomly with the only warming trend being no extra cold Springs since the 1980s.


The warmest Summer records show some increase, but the median and coolest data do not.


The Fall temperatures show some warming trends, but overall the data does not present a convincing trend of warming, with 18 steps upward, 16 downward and two remaining the same. The rate of change is not getting faster either.  This is another region where we cannot say with 95% confidence that we are seeing a warming trend.

Later today, region #8, which includes the rest of Alaska and much of northwest Canada, them extends southward down the Pacific coast to the central part of California.