Showing posts with label non warming regions. Show all posts

Monday, March 18, 2013

Four weeks of climate data:
Southern Temperate Region #6

The last region is the temperate section of the South Atlantic.


Just so we are clear, temperate islands are NOT tropical islands, and ten degrees of latitude can make a huge difference. It's cool in Tristan de Cunha and COLD in the South Georgia Islands.


A few years were taken out because only one island or the other was reporting. Taken together the Summer temperature jumped over a degree, which is definitely to be noticed.


On the other hand, the Fall median barely moved, though the record highs and lows did show a big jump.


In the Winter data, both the record high and median more of less flatline.


Spring shows increase in the high and median.

Confidence of the region warming:90.8%
Confidence of increasing rate: 79.2%
Change in median temperature from the 1955-1975 interval to the 1999-2010 interval: 0.46° C

We are not 95% confident the trend is warming here and the median composite rose less than a half degree Celsius in 56 years, which is not a serious cause for alarm.

This is the last region to look at in our Four Weeks of Climate Data, so now we will go into recap mode, looking at what regions are showing serious increases of more than a degree C from 1955-2010 and which ones are not warming as fast, starting with our six slices of the Arctic.


Saturday, March 16, 2013

Four weeks of climate data:
Southern Temperate Region #2

 The second region of the Southern Temperate Zone is the Indian Ocean with a few scattered islands.


There were only readings from a few islands, and the only weather station that kept consistent readings from 1955 to 2010 was on the French controlled island Kerguelen.


As I said earlier, this "temperate zone" is cold. This is down in The Fifties and Summer average temperatures wander between 3° C to 7° C. For Americans, that's between 37.4° F and 44.6° F.

Cold. The coldest metric shows an increase, but the median and high show that the 90s were a little warmer than the first decade of this century.


The Fall numbers look similar to Summer, only more so, the 90s warmer that The Oughts.


Winter's pattern is different. Generally we see an increase across all metrics, but very little overall.


Spring is like Winter, but all the metrics show the big jump between the 1955-1975 era and the 1975-1988 period.

Confidence of the region warming: 99%
Confidence of decreasing rate: 97.9%
Change in median temperature from the 1955-1975 interval to the 1999-2010 interval: 0.55° C

One island in an expanse of ocean, but it counts as a region.  It's warming but the rate is slowing down and the level of warming over 56 years is not particularly alarming.

Tomorrow, Australia and New Zealand lumped together in the third region then the gap between New Zealand and South America as Region #4.

Monday, March 11, 2013

Four weeks of climate data:
Northern Tropics Region #4

Even at full magnification of this map, the fourth region of the Northern Tropics looks empty, but looking carefully at the top middle, you will see a few dots that represent the Hawai'ian Islands.


There is one other island in the part of the Pacific that has a reliable weather station, and that is the American protectorate Johnson Island.


The patterns of the four season in Hawai'i all look about the same. There was a general warming trend in the last half of the 20th Century, but things dropped off in the first decade of the 21st.


Even with the drop-off, the median in the 1999-2010 era is slightly higher that the median for 1955-1975.


The story is repeated again.


The big difference between Fall and the other season is how consistent the record high temperature has stayed.

Confidence of the region warming: 90.8%
Confidence of decreasing rate: 99.9%
Change in median temperature from the 1955-1975 interval to the 1999-2010 interval: 0.14° C

We can't definitely show a warming trend overall, but it is extremely mild and the rate is getting absolutely getting slower.

Tomorrow, it's the last two parts of the Western Hemisphere's sections of the northern tropics, the first part dominated by Central America and the second part combining a little of the Guyanas in South America with a part of West Africa.
 

Sunday, March 3, 2013

Four weeks of climate data:
Northern Temperate Region #7


The seventh slice of the Northern Temperate Zone is the first in the Western Hemisphere moving from west to east. It includes a very small part of Russia and most of the populated part of Alaska, a term I used advisedly.


Alaska is definitely not Antarctica. There are people there and we get weather readings from all over the state.


The Winter data shows the record warm season was in this century, but there is no consistent trend of warming or cooling when looking at all three yardsticks.


The Spring data again looks like it bounces around randomly with the only warming trend being no extra cold Springs since the 1980s.


The warmest Summer records show some increase, but the median and coolest data do not.


The Fall temperatures show some warming trends, but overall the data does not present a convincing trend of warming, with 18 steps upward, 16 downward and two remaining the same. The rate of change is not getting faster either.  This is another region where we cannot say with 95% confidence that we are seeing a warming trend.

Later today, region #8, which includes the rest of Alaska and much of northwest Canada, them extends southward down the Pacific coast to the central part of California.
  

Saturday, March 2, 2013

Four weeks of climate data:
Northern Temperate Region #5


The two regions of the Northern Temperate Zone we looked at yesterday, the two that comprise the bulk of Asia in the Temperate Zone, did not show significant warming trends over our time period of 1955-2010, years chosen because they were both strong La NiƱa years. Today, we look at the last two parts of northeastern Asia, this one including Japan, both Koreas and parts of Russia and China.


The gaps we see are mostly due to regions of the grid being in the Pacific Ocean.


Winters in this region have bounced up and down, the high temperatures most noticeably showing a cooling trend in the 1970s. All our measurement standards have risen from the first interval to the last, the largest rise about a degree Celsius.


The Spring data shows a more consistent increase over time, both the lows and the median increasing steadily from time period to time period.


The Summer temperature metrics agree completely, a cooling trend in the 1975-1988 time interval and steady increase since. The difference in each measurement from the beginning interval to the most recent is only a half degree.

The Fall data shows a drop-off in the record temperature readings but a slight rising in the median and the low.

Largely due to the consistent increasing trend in the Spring and almost consistent trend in the Summer, the number of increases outnumbers the decreases 24-12 and when we put that number into the standard deviation from a 50-50 outcome, we are 95% confident this region shows a warming trend. As with many of our regions, the data showing the warming trend increasing is not conclusive.

Later today, the last Asian slice, mostly the Kamchatka peninsula and a lot of ocean.

Friday, March 1, 2013

Four weeks of climate data:
Northern Temperate Region #4

This region begs a lot of questions. The bottom fourth is the bulk of China, as densely populated a region as any on Earth. The rest is Mongolia, not even three million people, and then a slice of Siberia, probably less population density than Mongolia.

If people have something to do with climate change, the region containing China should show warming to a significant confidence level. But how far does the human element reach and in what direction?


The region is completely on land, but there are grid points that aren't well enough covered to be part of our average.


Winter's data is all over the place. The warmest Winter in the past 56 years is in this century, but the median and the coldest winter indicators both dropped from the 1988-1999 interval. The warmest record and the coldest record rose over a degree from the first time period to the last, but the median rose about a half degree, not an impressive climb in a half century.


Spring is one of those sets of data that showed "global cooling" in the 1970s, but since then we see a warming trend.  This time, the median jumps about a degree in a half century, but the highs and lows did not climb a complete degree in the same era.


Cooling then warming, every measurement showing less than a degree increase in a half century.

Not particularly impressive data.


The record Fall temperature this century is way below several high temperatures last century and all three measurement systems dropped from the 1988-1999 era to the 1999-2010 time period.

Simply enough, this is yet another region that does not show a significant warming from 1955 to 2010.  The Northern Temperate Zone goes through four of the most populated slices and only two show significant warming trends.

The story isn't over, but the idea that humans are a significant cause of widespread warming trends across the planet takes a significant hit with this data.

Tomorrow, we look at regions 5 and 6, the first two of four regions that are dominated by the North Pacific.

Four weeks of climate data:
Northern Temperate Region #3


The third zone is a study in several contrasts. The north is the start of the Asian part of Russia, sparsely populated, as is Kazakhstan, but the region also includes western China and northern India, which means it also includes the Himalayas. The method known as lapse rate lets us compare temperatures from different altitudes, but the differences in population density are very great.


As you can see, the region is fairly well covered, but there are gaps in the north and gaps in the mountainous regions in the south.


The Winter data looks very much like what you would expect in a region whose weather is static, neither significantly warming or cooling. The median in the 21st Century looks to be slightly cooler than the median from 1955-1975.


No strong trend over the entire era, but the big jumps are in the median temperature and the record average low temperature, both steps up happening at the turn of the century.


Because of a record warm Summer in the late 1950s, there is no evidence of warming in the record high measurement and much less than a degree of warming shown in the median and record lows when comparing the first interval (1955-1975) and the last (1999-2010).


The Fall data is much like the Summer, except that the rise in the median and the rise in the low are larger when comparing the first time period and the fourth.

Simply put, this is a region where there is not data that convinces us to 95% confidence level that warming is occurring, which makes the early count in the Northern Temperate Zone 2-1, warming vs. not warming.

Later today, the fourth slice of the Northern Temperate Zone, which contains much of Siberia, Mongolia and the greater part of China.

Tuesday, February 26, 2013

Four weeks of climate data: Antarctica Region #3


Region #3 of Antarctica is directly south of Australia and New Zealand, but a very long way away from either. As this map shows, Tierra Del Fuego in South America is the closest point to the southern continent, while Australia and New Zealand are farther away and southern Africa and Madagascar are further away still.


Yet again, incredibly sparse coverage of the region, one station on near the Ross Sea shelf and another close to the northern shore.


Summer high records showed a warming trend in the 20th Century, but that was canceled out in the 21st Century. This is a pattern we expect if there is no trend one way or another.

The Fall high temperature records look line a cooling trend based on one warm Fall in the 1950s, which only got data from one of the two weather stations.  This is one of those problems with so little coverage. Every other trend looks static.


The Winter high temperatures look to be cooling, but the median and low temperatures look to be warming.


The highs and lows show warming but the median looks fairly static in the Spring readings.

Once again, the null hypothesis must be no trend in either direction and this data doesn't convince us to deny that hypothesis.

Eastern Antarctica has not shown signs of warming over the past 60 years or so.

Later today, the first slice of Western Antarctica, with even less readings than the first three sections of the southern continent.


Monday, February 25, 2013

Four weeks of climate data:
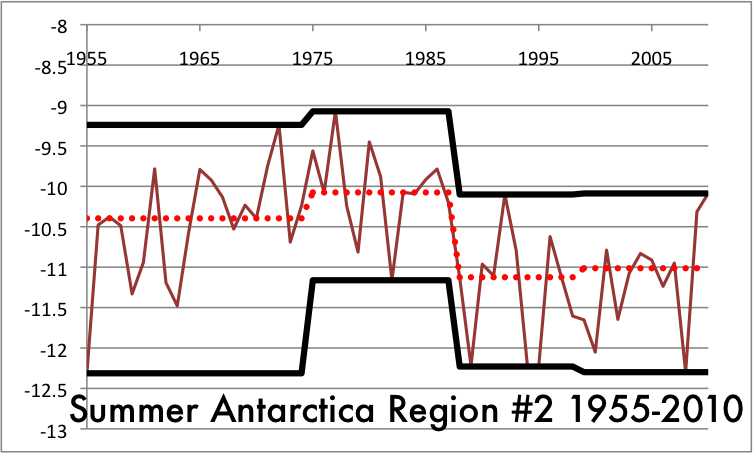
Antarctica Region #2


Continuing in the Eastern half of Antarctica, as remote from humans as any part of the planet can get.


At least this region gets coverage every year from 1955 to 2010 and has 4 of the 100 grid points checking in.  Still, this is very desolate, even compared to the Arctic Circle.


The Summer clear does not show a warming trend. In fact, the record highs and the median would argue this part of Antarctica is actually cooling.


The median in Fall shows some cooling trend, the highs and lows look relatively static. This kind of bouncing around is what we expect in a time interval that is not changing significantly.


Except that the coldest Winter this century was a lot warmer than cold Winters last century, this data looks like a cooling pattern.


There hasn't been a warm Spring to match the record set in the 1970s, but the last interval this century showed a slight uptick.

Once again, if the null hypothesis is no significant change, there is not enough data to dispute it, either as a warming trend or a cooling trend.

Tomorrow, the last Eastern Hemisphere slice and the first Western Hemisphere part.