China is not like the Sahara or Australia. It's farther away from the equator, it's not a mono-climate and it fits rather clumsily in a Mercator rectangle. It's not warming as fast as the Sahara, but it is showing much more warming than Australia. Most climate scientist I've talked to think of 2 degrees Celsius in a century as a "hair on fire number" .82 degrees in 56 years would average out to about 1.5 degrees in 100 year if this keeps up.
The region is very well covered by weather stations.
Of all the seasons, Winter is showing the greatest increase in median temperature from the 1955-1975 era to the 1999-2010 era, about 1.02 degrees Celsius. (The choice of the beginning and ending numbers of these eras is based on Strong La NiƱa years, for those of you who are new to my posts on climate.)
The Spring red dotted line jumps up by 0.94 degrees Celsius from the first era to the last.
Summer temperatures dipped in the time period from 1975 to 1988, but other than that we see an increasing trend.
Fall temperature also have just one dip, but this one is from the end of last century to the beginning of this one.
Confidence level of warming from time interval to time interval: 99%
Confidence level of the trend showing increasing warming: 94.87%
Average seasonal change in the medians of 1955-1975 to 1999-2010: 0.82° C.
Tuesday, April 9, 2013
Monday, April 8, 2013
Climate Data:
Australia 1955-2010
Geographically, Australia has a lot in common with the Sahara. They are about the same distance from the equator, the Sahara to the north and Australia to the south, and the northern section of Africa is a little wider west to east. Both regions are dominated by deserts with very little water.
The major difference in climate is simply stated. Australia is not warming as quickly or as convincingly as the Sahara. Less than half a degree Celsius in 56 years is not particularly alarming, not like the 1.08° C change seen in the Sahara.
The grid coverage of Australia from 1955 to 2010 has a few points in the west without any coverage, but ignoring those few glitches, the shape of the grid closely matches the shape of the country.
Since Australia is south of the equator, we begin the year with the Summer temperatures. In every one of our measuring systems (also called metrics), the numbers bounce around. Because I distrust cherry picking, I look first at the median of our time periods, marked in the dotted bright red line, and there we see an increase from the first era (1955-1977) to the last (1999-2010).
Change in 1955-1975 median to 1999-2010 median: 0.4705° C.
The changes in the Fall numbers also look generally random, but the median does show an increase, also less than a half degree.
Change in 1955-1975 median to 1999-2010 median: 0.395° C.
The Winter variations show a step increase function in the record highs and lows, but the median took a step down between the 1988-1999 era and the most recent one.
Change in 1955-1975 median to 1999-2010 median: 0.493° C.
Spring show slow but steady increase in nearly every metric across the board.
Change in 1955-1975 median to 1999-2010 median: 0.569° C.
Confidence level of warming from time interval to time interval: 99.6%
Confidence level of the trend showing decreasing warming: 79.2%
Average seasonal change in the medians of 1955-1975 to 1999-2010: 0.48° C.
While the Sahara and Australia have geographical traits in common, the climates are moving in very different ways. Australia is warming, but not by alarming amounts and we have no confidence the rate is increasing and a very tepid confidence the rate is decreasing.
It would be nice if there was a reasoned discussion of the data, but the current climate of discussion makes that seem impossible.
The major difference in climate is simply stated. Australia is not warming as quickly or as convincingly as the Sahara. Less than half a degree Celsius in 56 years is not particularly alarming, not like the 1.08° C change seen in the Sahara.
The grid coverage of Australia from 1955 to 2010 has a few points in the west without any coverage, but ignoring those few glitches, the shape of the grid closely matches the shape of the country.
Since Australia is south of the equator, we begin the year with the Summer temperatures. In every one of our measuring systems (also called metrics), the numbers bounce around. Because I distrust cherry picking, I look first at the median of our time periods, marked in the dotted bright red line, and there we see an increase from the first era (1955-1977) to the last (1999-2010).
Change in 1955-1975 median to 1999-2010 median: 0.4705° C.
The changes in the Fall numbers also look generally random, but the median does show an increase, also less than a half degree.
Change in 1955-1975 median to 1999-2010 median: 0.395° C.
The Winter variations show a step increase function in the record highs and lows, but the median took a step down between the 1988-1999 era and the most recent one.
Change in 1955-1975 median to 1999-2010 median: 0.493° C.
Spring show slow but steady increase in nearly every metric across the board.
Change in 1955-1975 median to 1999-2010 median: 0.569° C.
Confidence level of warming from time interval to time interval: 99.6%
Confidence level of the trend showing decreasing warming: 79.2%
Average seasonal change in the medians of 1955-1975 to 1999-2010: 0.48° C.
While the Sahara and Australia have geographical traits in common, the climates are moving in very different ways. Australia is warming, but not by alarming amounts and we have no confidence the rate is increasing and a very tepid confidence the rate is decreasing.
It would be nice if there was a reasoned discussion of the data, but the current climate of discussion makes that seem impossible.
Sunday, April 7, 2013
Climate data:
Sahara Desert 1955-2010
When I first did the climate data, the regions were chopped up along specific latitude and longitude line. Now I want to look at regions that we think of as being mono-climates. The first one is the Sahara Desert.
Here is a map of the grid which shows where the temperature data was collected. The rectangle I chose was 15° West to 35° East in longitude and 10° North to 35° North in latitude. As you can see, there is a lot of the middle of the desert that is not being measured. Still, there were a total of 42,708 seasonal readings, so this is not a place with next to no data like certain regions of the poles.
Until this century, the Winter temperatures in the Sahara were bouncing around somewhat randomly, even showing a mild cooling trend when we look at the record highs and lows. The median was climbing up but only slightly.
Then came the 1999-2010 time period and things jumped up on both the record highs and record lows.
Change in 1955-1975 median to 1999-2010 median: 0.872° C, more than the worldwide average of about 0.5° C. I arbitrarily consider 1 degree Celsius to be the cut-off for very serious warming.
The Spring data was showing some warming in the last half of the 20th Century and that only increased in the first decade of the 21st.
Change in 1955-1975 median to 1999-2010 median: 1.164° C.
The Summer data shows the classic increasing temperature steps.
Change in 1955-1975 median to 1999-2010 median: 1.1185° C.
The Fall data is also unambiguous.
Change in 1955-1975 median to 1999-2010 median: 1.178° C.
Confidence level of warming from time interval to time interval: 99.999%
Confidence level of the trend showing increasing warming: 97.9%
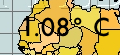
Average seasonal change in the medians of 1955-1975 to 1999-2010: 1.08° C.
Like much of the Arctic Circle and parts of Western Antarctica, the Sahara is one of those regions that show serious warming over these 56 years.
Here is a map of the grid which shows where the temperature data was collected. The rectangle I chose was 15° West to 35° East in longitude and 10° North to 35° North in latitude. As you can see, there is a lot of the middle of the desert that is not being measured. Still, there were a total of 42,708 seasonal readings, so this is not a place with next to no data like certain regions of the poles.
Until this century, the Winter temperatures in the Sahara were bouncing around somewhat randomly, even showing a mild cooling trend when we look at the record highs and lows. The median was climbing up but only slightly.
Then came the 1999-2010 time period and things jumped up on both the record highs and record lows.
Change in 1955-1975 median to 1999-2010 median: 0.872° C, more than the worldwide average of about 0.5° C. I arbitrarily consider 1 degree Celsius to be the cut-off for very serious warming.
The Spring data was showing some warming in the last half of the 20th Century and that only increased in the first decade of the 21st.
Change in 1955-1975 median to 1999-2010 median: 1.164° C.
The Summer data shows the classic increasing temperature steps.
Change in 1955-1975 median to 1999-2010 median: 1.1185° C.
The Fall data is also unambiguous.
Change in 1955-1975 median to 1999-2010 median: 1.178° C.
Confidence level of warming from time interval to time interval: 99.999%
Confidence level of the trend showing increasing warming: 97.9%
Average seasonal change in the medians of 1955-1975 to 1999-2010: 1.08° C.
Like much of the Arctic Circle and parts of Western Antarctica, the Sahara is one of those regions that show serious warming over these 56 years.
Friday, April 5, 2013
The "middle" of a triangle, Method #3: The incenter
We come to another idea of where the center of a triangle is, a method called the incenter. This is the point that is the center of the circle that is inscribed within the triangle, tangent to all three sides.
Once again, the point is defined as the meeting place for three lines. This time, the lines are the angle bisectors for the three angles. Like the centroid, the incenter must be in the interior of the triangle, which is not true for the circumcenter of an obtuse triangle.
Wednesday, April 3, 2013
Triangle classification and circumcenters
On Monday, we started the discussion of the "center" of a triangle, put in quotation marks because it is too vague. The centroid is the center of gravity and is always in the interior of the triangle, but the circumcenter, the center of the circle that passes through all three vertices, does not have to be in the interior. Here are the three possibilities.
We are going to classify triangles by the size of the largest angle. Since the angles always add up to 180°, we can only have one angle that is 90° or greater, and it is possible to have all the angles less than 90°. If they are all less than 90°, the triangle is classified as acute and the circumcenter will be in the interior of the triangle.
The next possibility is that the largest angle is exactly 90°, which we call a right angle, so we classify these triangles as right triangles. With a right traingle. the circumcenter will always be at the midpoint of the longest side, usually called the hypotenuse.
The last possibility is called an obtuse triangle, one whose largest angle is more than 90°. In this case, the circumcenter will not be in the triangle's interior.
Notice that a triangle inscribed in a circle creates three arcs. The total measure of those arcs is 360°. It turns out the measure of each arc is twice the measure of the angle that creates the arc. For example, if an inscribed triangle had angles 45°, 35° and 100°, the three arcs would measure 90°, 70° and 200° respectively. The center of the circle would inside the arc of 200° but outside the interior of the triangle itself.
(Note: all these illustrations were nicked from a webpage created by Kristina Dunbar of UGA.)
Tomorrow: the incenter of the triangle.
We are going to classify triangles by the size of the largest angle. Since the angles always add up to 180°, we can only have one angle that is 90° or greater, and it is possible to have all the angles less than 90°. If they are all less than 90°, the triangle is classified as acute and the circumcenter will be in the interior of the triangle.
The next possibility is that the largest angle is exactly 90°, which we call a right angle, so we classify these triangles as right triangles. With a right traingle. the circumcenter will always be at the midpoint of the longest side, usually called the hypotenuse.
The last possibility is called an obtuse triangle, one whose largest angle is more than 90°. In this case, the circumcenter will not be in the triangle's interior.
Notice that a triangle inscribed in a circle creates three arcs. The total measure of those arcs is 360°. It turns out the measure of each arc is twice the measure of the angle that creates the arc. For example, if an inscribed triangle had angles 45°, 35° and 100°, the three arcs would measure 90°, 70° and 200° respectively. The center of the circle would inside the arc of 200° but outside the interior of the triangle itself.
(Note: all these illustrations were nicked from a webpage created by Kristina Dunbar of UGA.)
Tomorrow: the incenter of the triangle.
Tuesday, April 2, 2013
The "middle" of a triangle, Method #2:
The circumcenter
Yesterday, we discussed the centroid, the simplest way to measure the center of a triangle. For a triangle drawn as three vertices and the lines that connect them, draw the lines from each vertex to the midpoint of the opposite line. They will meet in a single point and that point is the centroid. Another way to do it is if you have the coordinates of the three points, the centroid's x value is the average of the x values and likewise its y value is the average if the y values.
Here is a different way to get a center of a triangle, the point that is the same distance away from each vertex. The geometric solution is to find the midpoint of each line segment of the triangle then draw the perpendicular bisector of the segment. The three perpendicular bisectors will all meet at a single point. The red circle in this picture is the only circle that goes through all three points A, B and C, and as this picture shows, it's not really necessary to do all three perpendicular bisectors, because the third will also pass through the point indicated by the green arrow.
If we had the coordinates for A, B and C, we would use them to find the midpoints and slopes of each line segments, call them mid1, mid2 and mid3 and slope1, slope2 and slope3. It's possible that one of the slopes is zero, but it isn't possible to have two slopes equal to each other, because that would mean two lines are parallel, impossible if they are sides of a triangle. Choose two lines with non-zero slopes and take the slope of the perpendicular, which equals -1/slope. Without loss of generality, let's assume that lines 1 and 2 don't have a zero slope. Then we just need to solve for x and y in the following pair of simultaneous linear equations.
y - y_from_mid1 = -1/slope1(x - x_from_mid1)
y - y_from_mid2 = -1/slope2(x - x_from_mid2)
It might look daunting, but the methods are fairly straightforward.
One "unusual" attribute of a circumcenter is that it doesn't have to be on the inside of the triangle. In fact, the rules for the position are based on the classification of the triangle.
Tomorrow, classifications and circumcenters.
Monday, April 1, 2013
The "middle" of a triangle, Method #1:
The centroid
If we have a line segment, the midpoint is a simply defined thing, the point that cuts the segment into two equal parts. In this picture of the triangle ABC, the unlabeled red dots on each of the blue lines are the midpoints and the tick marks are place to indicate that each line segment has been cut in half. The segment BC has two copies of a single tick mark |, the segment AC has double tick marks // and the segment AB has triple tick marks \\\.
When we talk about the center of a traingle, there are several different ways to discuss it. One of the easiest is the centroid, which is here labeled G. The method used here is to draw a line from each vertex to the midpoint of the opposite side. You only actually have to draw two, because the third line is promised to cross at the same place.
You will notice that the orange line segments cut the blue triangle into six parts. Because G is the centroid, the areas of triangles AGB, BGC and AGC are all equal. More than that, each of the smaller six triangles has exactly one sixth of the area of ABC.
The method above has no coordinate system tied to it. Instead, it is planar geometry done in the classic Greek style, with diagrams that can be drawn using only a straightedge and a compass.
In the drawing here, the three vertices are given coordinates, specifically (1, 2), (3, 4) and (5, 0). The coordinates make drawing the lines from vertices to midpoints unnecessary, because instead we can just take the average of the x coordinates and the average of the y coordinates as our corresponding x and y values. In this case, (1+3+5)/3 = 9/3 = 3, and (2+4+0)/3 = 6/3 = 2, so the centroid is (3, 2), the point marked in red.
Tomorrow, we will look at the definition of the circumcenter, a point that is the same distance away from all three of the vertices.
When we talk about the center of a traingle, there are several different ways to discuss it. One of the easiest is the centroid, which is here labeled G. The method used here is to draw a line from each vertex to the midpoint of the opposite side. You only actually have to draw two, because the third line is promised to cross at the same place.
You will notice that the orange line segments cut the blue triangle into six parts. Because G is the centroid, the areas of triangles AGB, BGC and AGC are all equal. More than that, each of the smaller six triangles has exactly one sixth of the area of ABC.
The method above has no coordinate system tied to it. Instead, it is planar geometry done in the classic Greek style, with diagrams that can be drawn using only a straightedge and a compass.
In the drawing here, the three vertices are given coordinates, specifically (1, 2), (3, 4) and (5, 0). The coordinates make drawing the lines from vertices to midpoints unnecessary, because instead we can just take the average of the x coordinates and the average of the y coordinates as our corresponding x and y values. In this case, (1+3+5)/3 = 9/3 = 3, and (2+4+0)/3 = 6/3 = 2, so the centroid is (3, 2), the point marked in red.
Tomorrow, we will look at the definition of the circumcenter, a point that is the same distance away from all three of the vertices.
Subscribe to:
Posts (Atom)